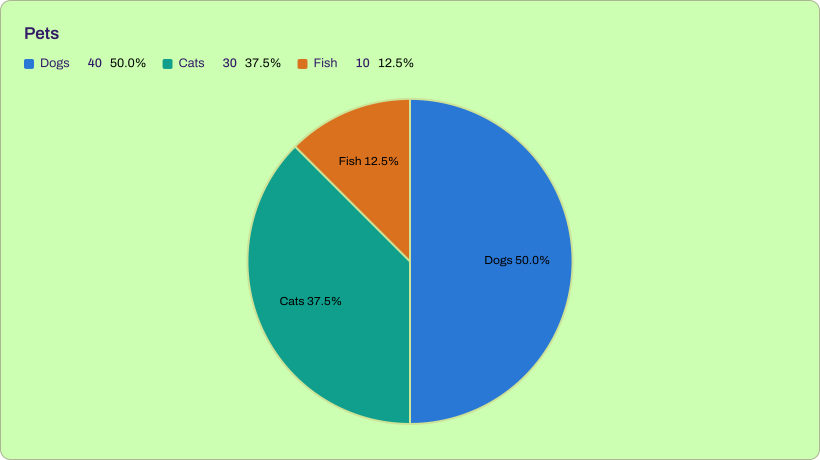
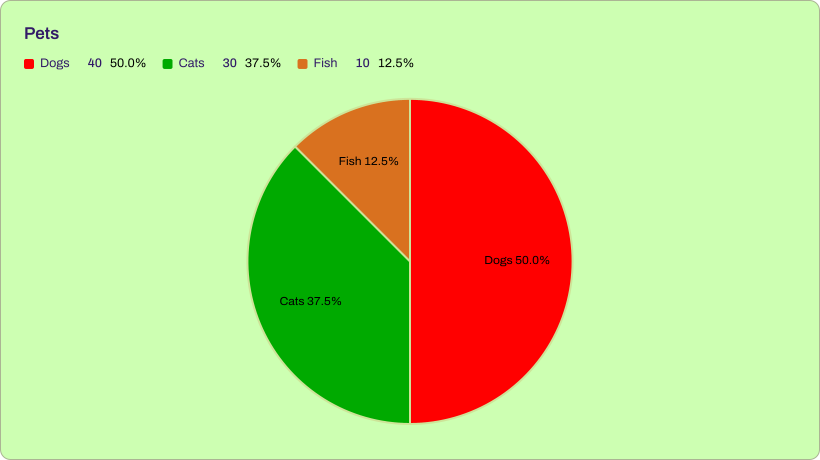
These changes are merged and ship together in the next release of all nine ChartForgeX packages. Each pair below renders the same input with ChartForgeX 4.0.2 and with the new release. Earlier versions are listed on GitHub Releases.
In the next release
Topology edges are solid unless something is wrong
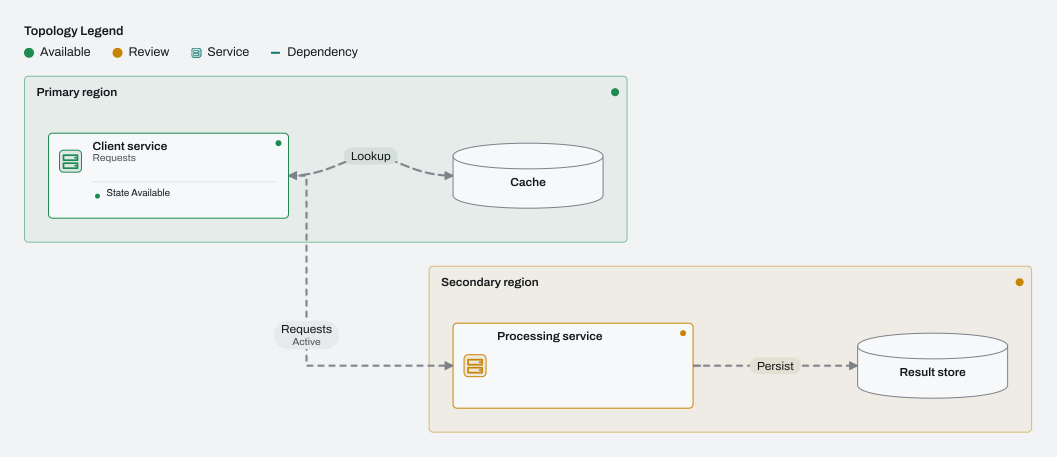
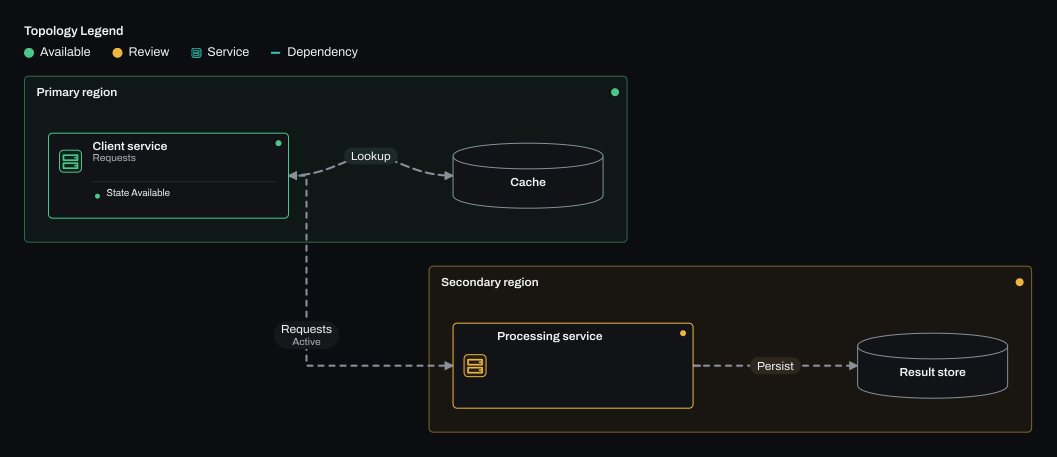
An edge's default status is Unknown, which used to draw a dashed line. Most diagrams came out dashed, including hosts that map healthy, configured links to Unknown to keep them neutral. Unknown and Healthy edges are now solid. Warning and Critical edges keep their 8 5 dash and Disabled edges their 3 6 dash, and an explicit LineStyle or dash pattern still wins. SVG and PNG agree.
Diagonal neighbours connect with one bend
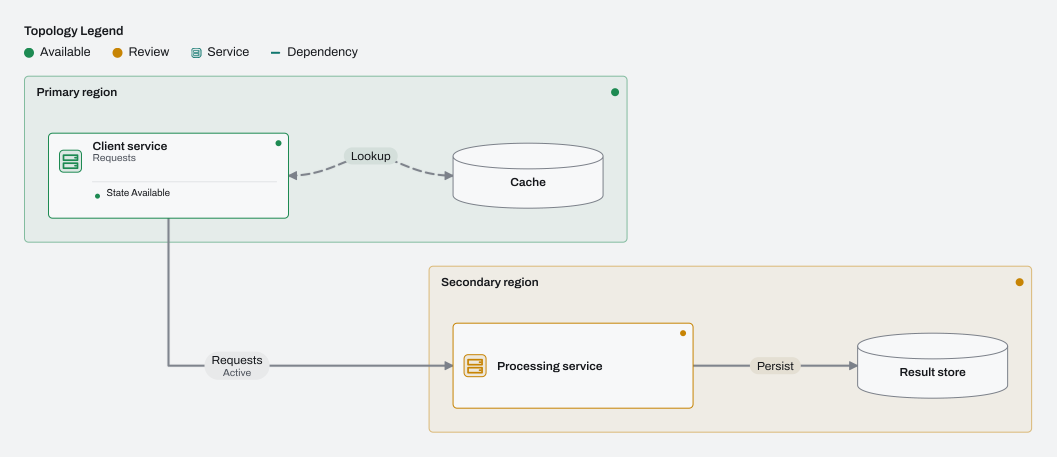
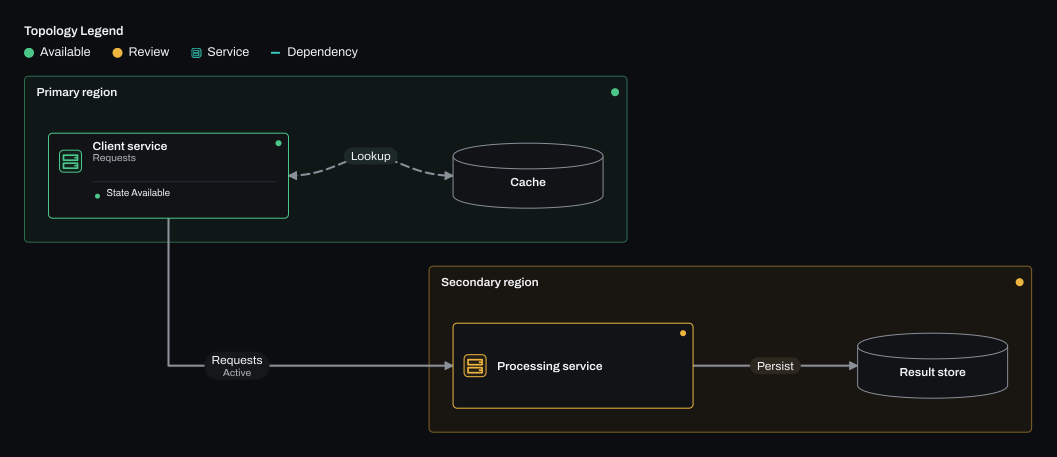
The obstacle-avoiding router now also offers single-bend routes between nodes that sit diagonally from each other, scored with the same obstacle, caption and label rules as the two-bend routes. In the diagram below, Requests leaves the bottom of Client service and turns once, instead of sharing the arrow point of Lookup. Authored and named ports are unchanged, and readable dense layouts still use their own planner.
Title-only cards centre their heading
A card without details or a badge now centres its heading and subtitle beside its glyph instead of leaving the lower half empty. Processing service below shows it; organisation charts get the same treatment.
Heatmap keys
Key captions now sit a few pixels below the colour strip instead of touching it, and middle captions keep a full spacing from the end captions. Cell values can be printed inside the cells with WithHeatmapValueTextMode(ChartHeatmapValueTextMode.Always) or data labels; each label picks a contrasting ink for its cell.
Mermaid pie colours
Pie charts apply themeVariables.pie1 to pie12 to their slices and pieTitleTextColor to the title. The Mermaid support matrix now has a theme-mapping section that lists which variables map where and which don't yet.