Charts, service maps, dashboards and animated stories from the objects your scripts already have, in Windows PowerShell 5.1 and PowerShell 7. Every script on this page ran as shown against the published module, next to the files it wrote and the console output it printed.
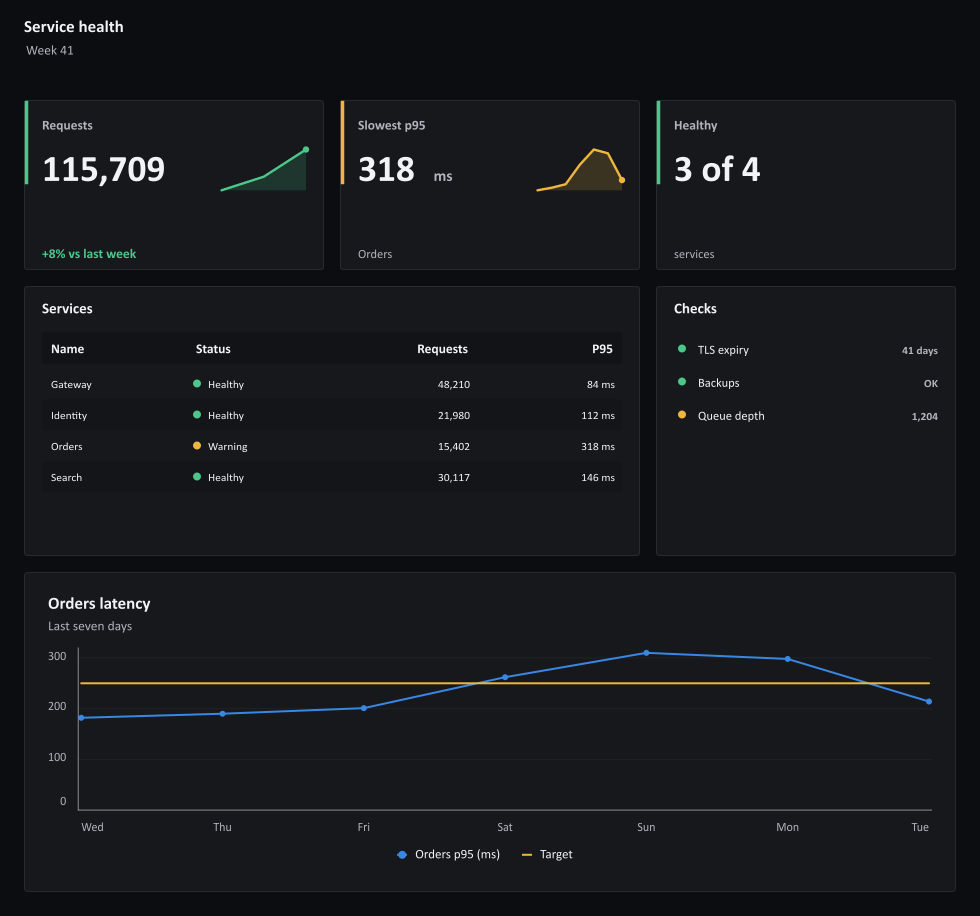
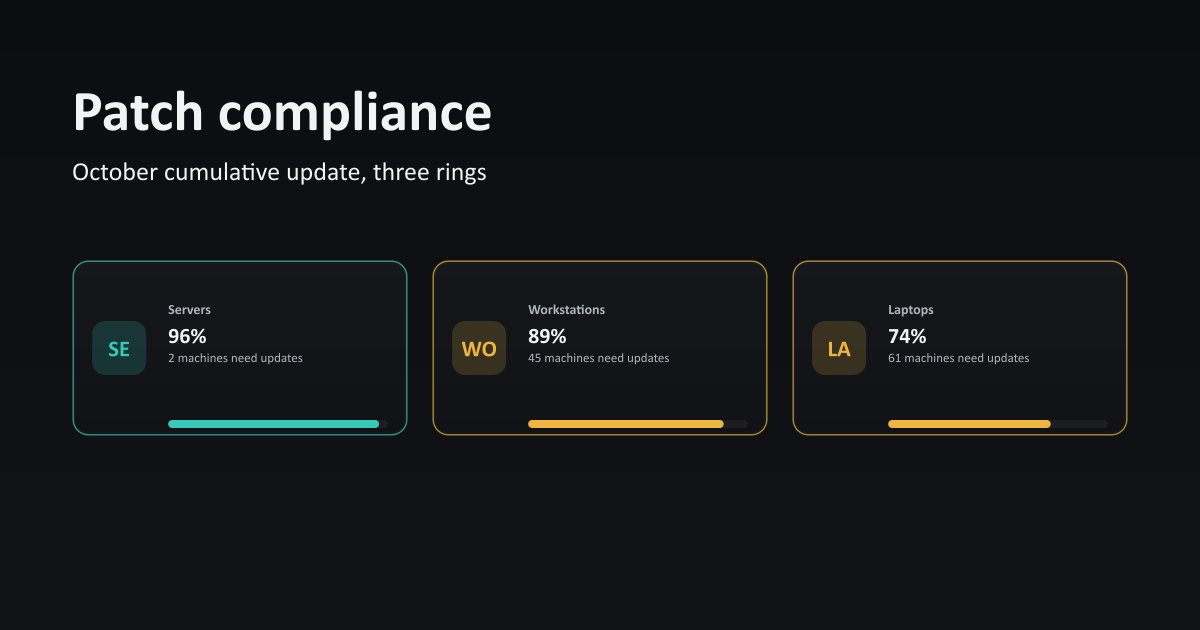
Metric cards, a status table, a checklist and a latency chart composed into one grid. The same grid writes a PNG for chat and email and an HTML page for a browser.
PowerShellservice-health.ps1
# Service data from a monitoring API, a CSV export or Get-Counter.
$services = @'
Name,Status,Requests,P95
Gateway,Healthy,48210,84
Identity,Healthy,21980,112
Orders,Warning,15402,318
Search,Healthy,30117,146
'@ | ConvertFrom-Csv
$week = 182, 190, 201, 262, 310, 298, 214   # Orders p95, last seven days
$theme = 'Dark'

$total = ($services | Measure-Object Requests -Sum).Sum
$slowest = $services | Sort-Object { [int] $_.P95 } | Select-Object -Last 1
$healthy = @($services | Where-Object Status -eq 'Healthy').Count

# -PassThru returns the chart so the dashboard can embed it.
$latency = New-ImageChart -Title "$($slowest.Name) latency" -Subtitle 'Last seven days' `
    -XLabel Wed, Thu, Fri, Sat, Sun, Mon, Tue -FilePath latency.png `
    -Width 932 -Height 320 -Theme $theme -ShowGrid -PassThru `
    -Options (New-ImageChartOptions -ShowLegend -LegendPosition Bottom -TickCount 4) {
    New-ImageChartLine -Name "$($slowest.Name) p95 (ms)" -Value $week -Marker Circle
    New-ImageChartLine -Name 'Target' -Value (@(250) * $week.Count) -Color '#eeb640'
}

# Pipe the rows in and pick columns the way Format-Table does.
$table = $services | New-ImageTableBlock -Title Services -StatusColumn Status `
    -Theme $theme -Width 616 -Height 270 -Property Name, Status,
    @{ Name = 'Requests'; Expression = { [int] $_.Requests }; FormatString = 'N0'; Alignment = 'Right' },
    @{ Name = 'P95'; Expression = { "$($_.P95) ms" }; Alignment = 'Right' }

$checks = @{
    Title  = 'Checks'
    Item   = 'TLS expiry', 'Backups', 'Queue depth'
    Value  = '41 days', 'OK', '1,204'
    Status = 'Positive', 'Positive', 'Warning'
    Theme  = $theme; Width = 300; Height = 270
}

$card = @{ Width = 300; Height = 170; Theme = $theme }
$grid = @{
    Title = 'Service health'; Subtitle = 'Week 41'; Columns = 3
    Gap = 16; Padding = 24; AdaptiveRowHeights = $true; Theme = $theme
}
$dashboard = New-ImageVisualGrid @grid -ContentDefinition {
    New-ImageMetricCard -Label Requests -Value $total -Format N0 -Status Positive `
        -Trend '+8% vs last week' -MiniValues 98, 101, 104, 110, 116 @card
    New-ImageMetricCard -Label 'Slowest p95' -Value ([int] $slowest.P95) -Unit ms `
        -Caption $slowest.Name -Status Warning -MiniValues $week @card
    New-ImageMetricCard -Label Healthy -Value "$healthy of $($services.Count)" `
        -Caption services -Status Positive @card
    New-ImageVisualGridItem -Block $table -ColumnSpan 2
    New-ImageListBlock @checks
    New-ImageVisualGridItem -Chart $latency -ColumnSpan 3
}

# One dashboard, two outputs: PNG for chat and email, HTML for a browser.
foreach ($file in 'service-health.png', 'service-health.html') {
    $dashboard | New-ImageVisualStory -FilePath $file
}

$services | Sort-Object { [int] $_.P95 } -Descending | Format-Table -AutoSize
Charts from pipeline objects
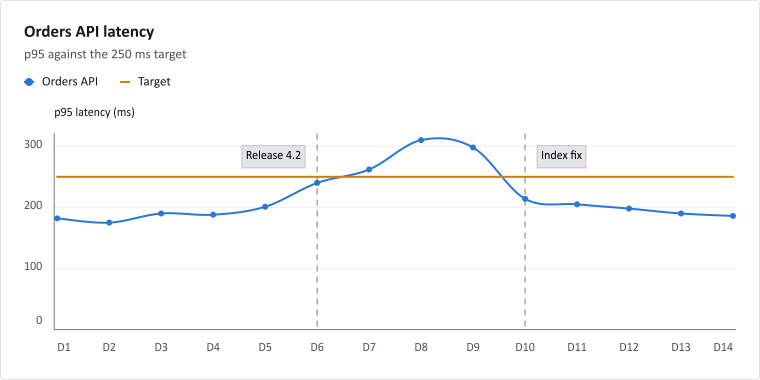
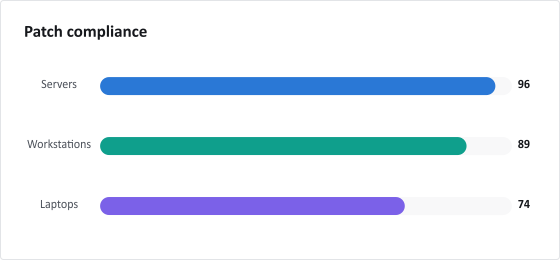
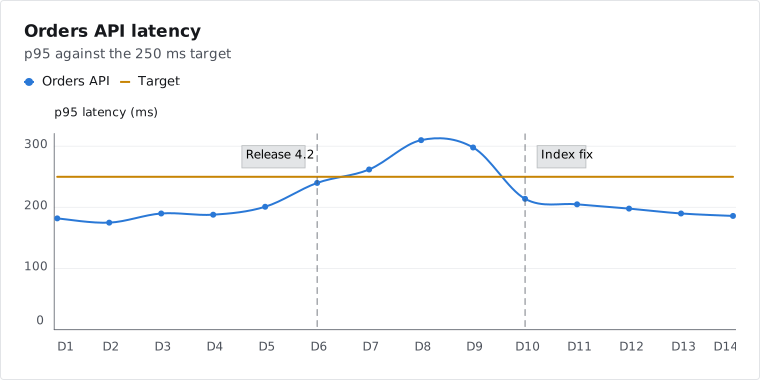
Each chart starts from rows a script already has: Import-Csv, Group-Object or a hashtable. The console block under every chart is what the script printed.
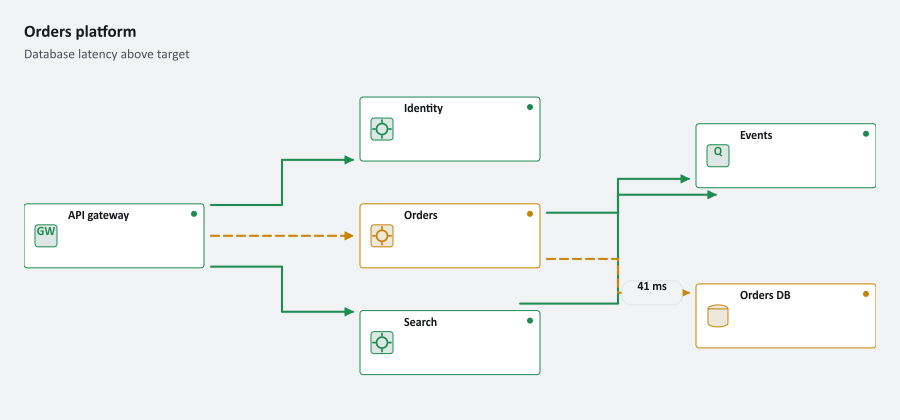
# Who calls whom, from a CMDB export or a config file.
$services = @'
Id,Name,Kind,Tier,Status,Callers,Latency
gateway,API gateway,Gateway,0,Healthy,,
identity,Identity,Service,1,Healthy,gateway,
orders,Orders,Service,1,Warning,gateway,
search,Search,Service,1,Healthy,gateway,
sql,Orders DB,Database,2,Warning,orders,41 ms
events,Events,Queue,2,Healthy,orders search,
'@ | ConvertFrom-Csv

$map = {
    # -Layer puts each tier in its own column; the layout does the rest.
    foreach ($s in $services) {
        New-ImageTopologyNode -Id $s.Id -Label $s.Name -Kind $s.Kind `
            -Status $s.Status -Layer $s.Tier -Width 180 -Height 64
    }
    foreach ($s in $services) {
        foreach ($caller in (-split $s.Callers) -ne '') {
            New-ImageTopologyEdge $caller $s.Id $s.Latency `
                -Direction Forward -Status $s.Status
        }
    }
}

$view = @{
    TopologyDefinition   = $map
    Title                = 'Orders platform'
    Subtitle             = 'Database latency above target'
    Layout               = 'Layered'
    Direction            = 'LeftToRight'
    Width                = 900
    Height               = 420
    FitContentToViewport = $true
}
New-ImageTopology @view -FilePath service-map.png
New-ImageTopology @view -FilePath service-map.html -InteractiveHtml

$services | Format-Table Name, Kind, Status, Callers -AutoSize
PS> ./service-map.ps1
Name        Kind     Status  Callers
----        ----     ------  -------
API gateway Gateway  Healthy
Identity    Service  Healthy gateway
Orders      Service  Warning gateway
Search      Service  Healthy gateway
Orders DB   Database Warning orders
Events      Queue    Healthy orders search
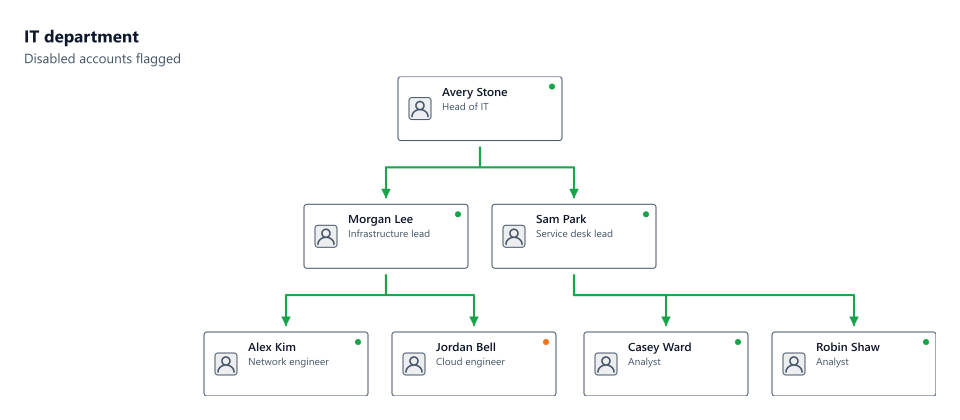
Name        Title               Manager Enabled
----        -----               ------- -------
Avery Stone Head of IT                  True
Morgan Lee  Infrastructure lead avery   True
Sam Park    Service desk lead   avery   True
Alex Kim    Network engineer    morgan  True
Jordan Bell Cloud engineer      morgan  False
Casey Ward  Analyst             sam     True
Robin Shaw  Analyst             sam     True
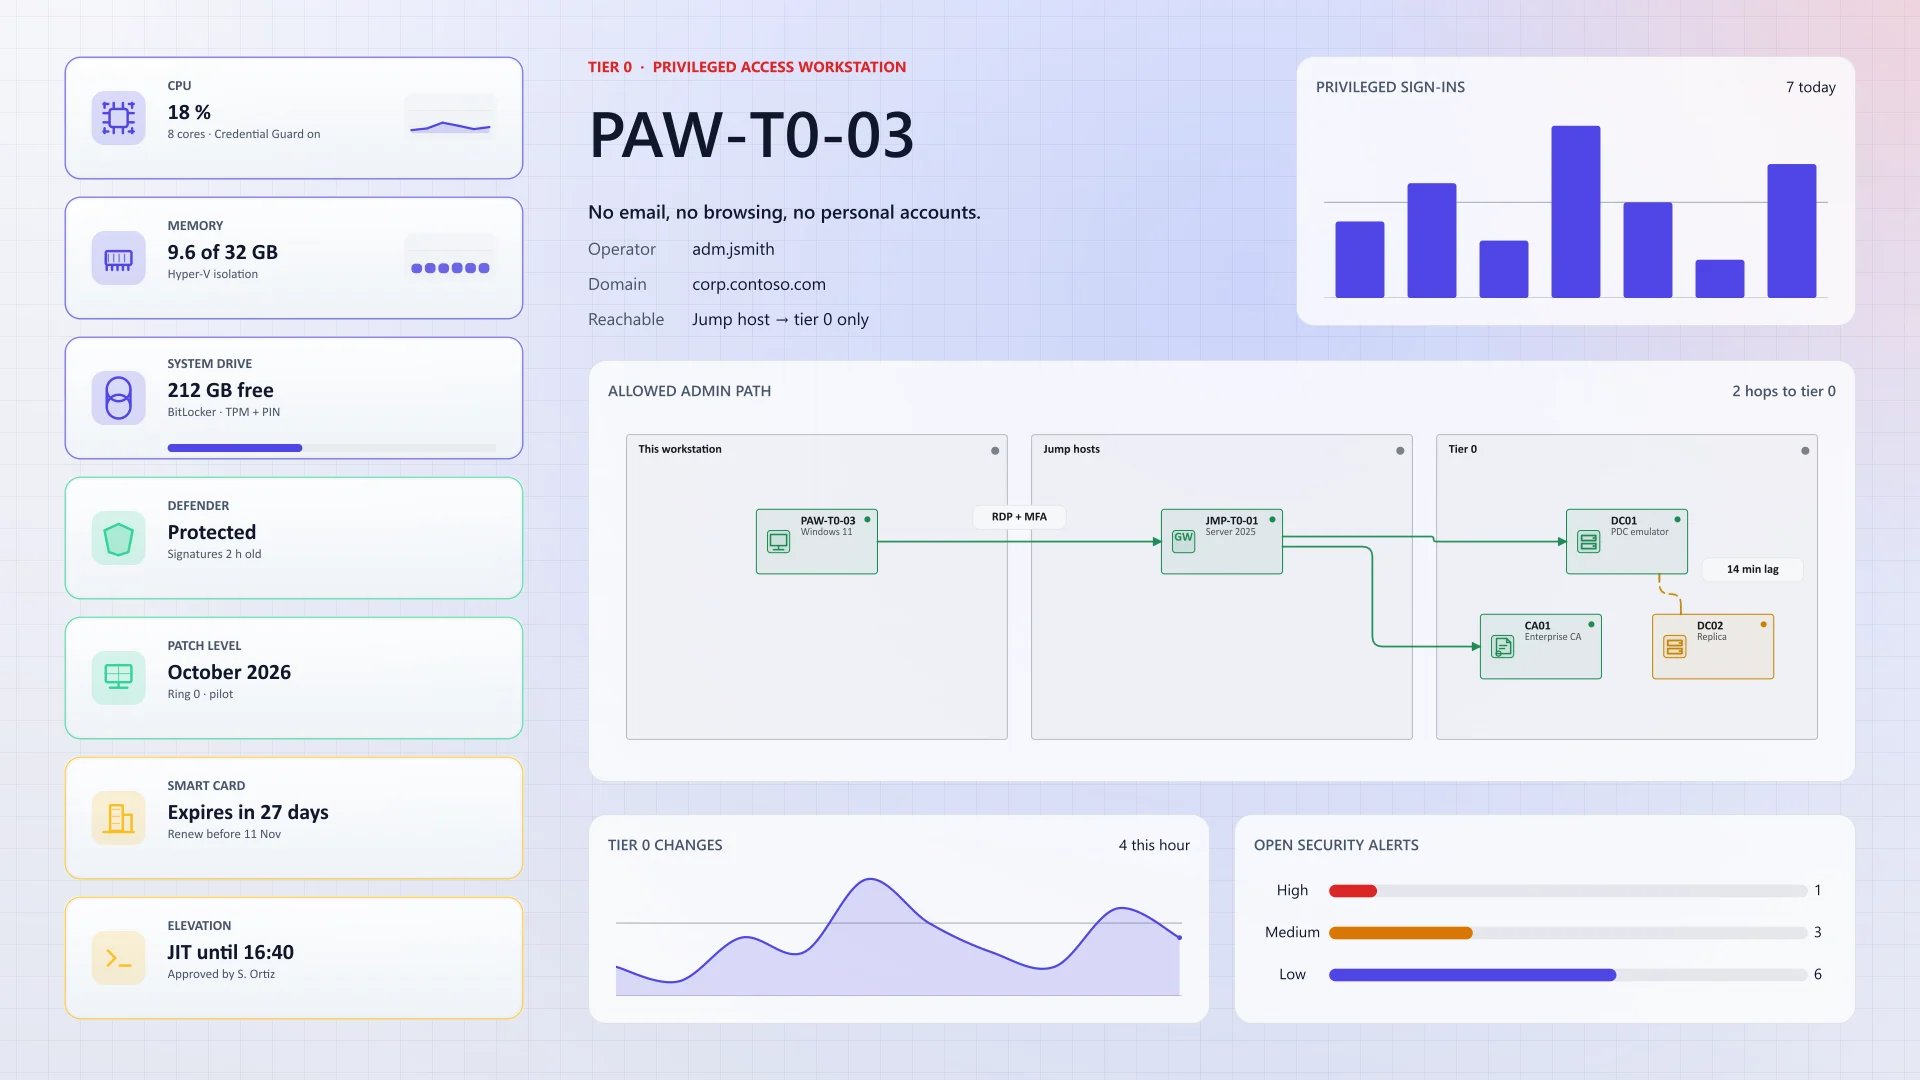
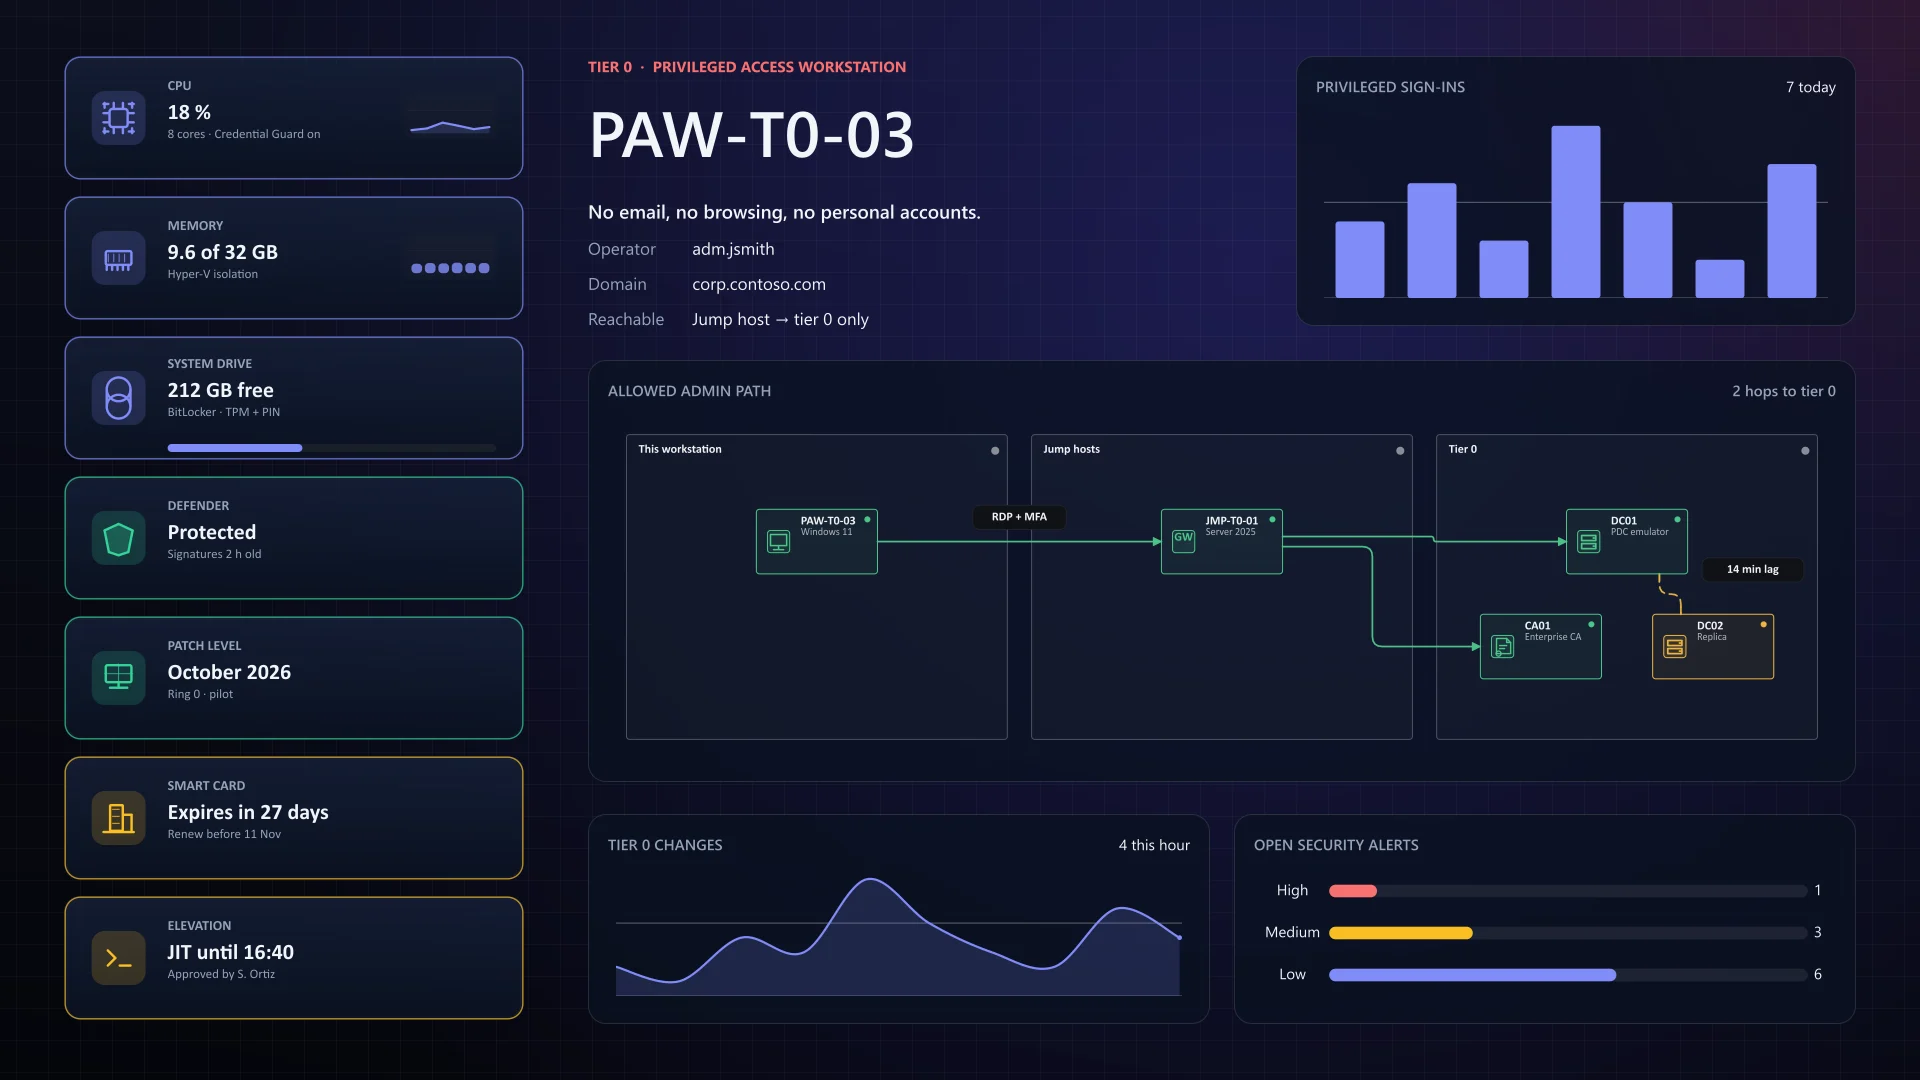
PowerBGInfo is a separate Evotec module built on the same engine. Its scripts put machine details, charts, tables and diagrams on Windows desktop and lock-screen wallpapers, and ChartForgeX draws the whole image.
ImagePlayground 3.3.0 exports 132 commands for Windows PowerShell 5.1 and PowerShell 7+. These 77 render through ChartForgeX; each name opens its reference page with parameters and examples.
Charts 34
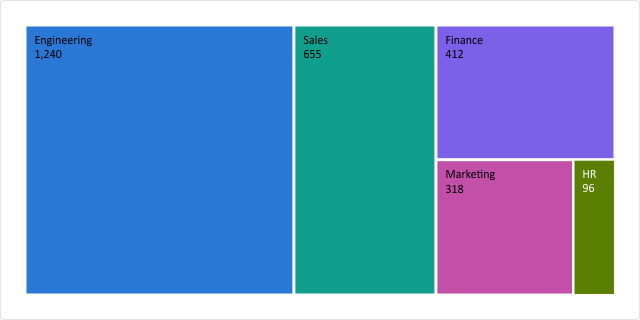
Line, area, bar, donut, radar, heatmap, treemap, waterfall, word cloud and more, as PNG, SVG, JPEG or HTML.
ChartForgeX ships features first; ImagePlayground exposes them as commands. This table describes ImagePlayground 3.3.0: rows marked available work from commands alone, and partial rows work with the limits noted, often through -ChartScript, which hands a script the ChartForgeX chart and its .NET API.
Available works in ImagePlayground 3.3.0
Partial works with the limits noted
Planned in ChartForgeX, not yet a command
Charts
Available
Thirty chart kinds as commands: line, area, stacked and step area, bar, horizontal bar, scatter, bubble, lollipop, range, box plot, histogram, heatmap, pie, donut, radial, gauge, progress, pictorial, bullet, funnel, treemap, waterfall, radar, polar, slope and word cloud