Skip to content
ChartForgeX

Treemap examples in C#

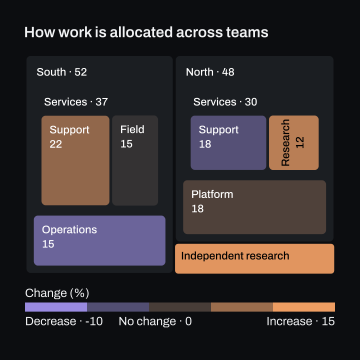
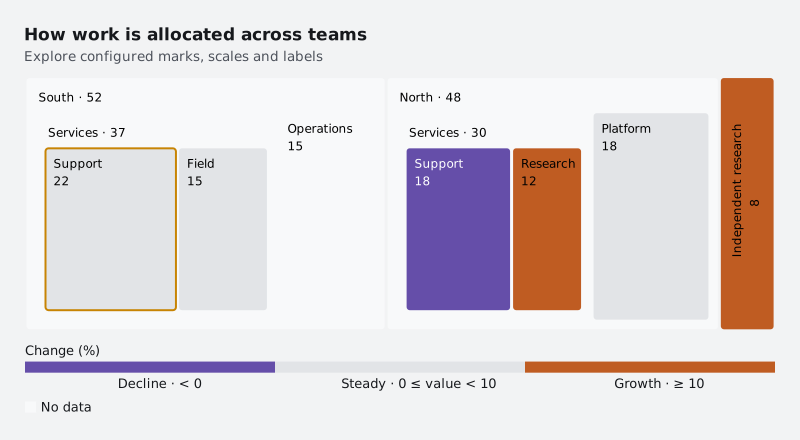
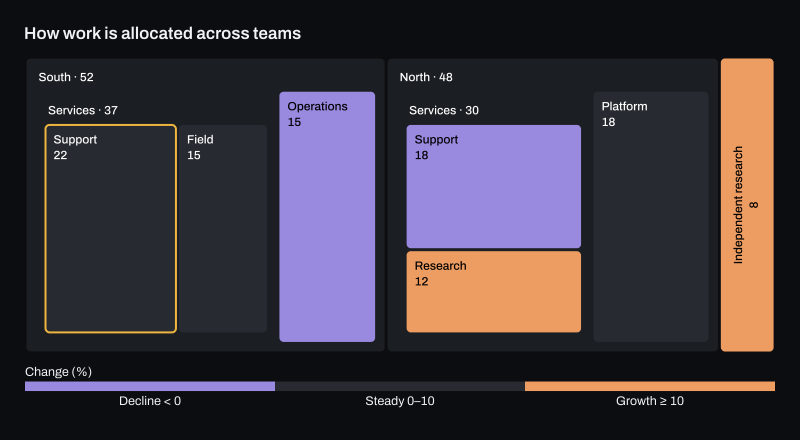
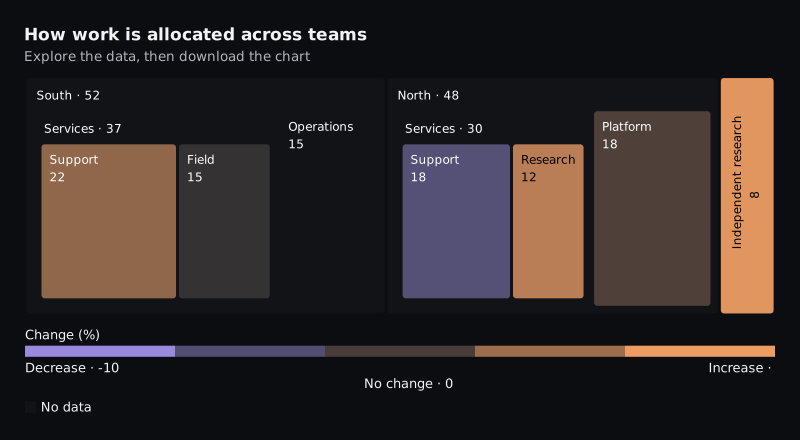
Treemap examples rendered by ChartForgeX: a live chart, variants in light and dark themes, the C# source and the options to configure it.

All charts Parts of a wholeTreemap

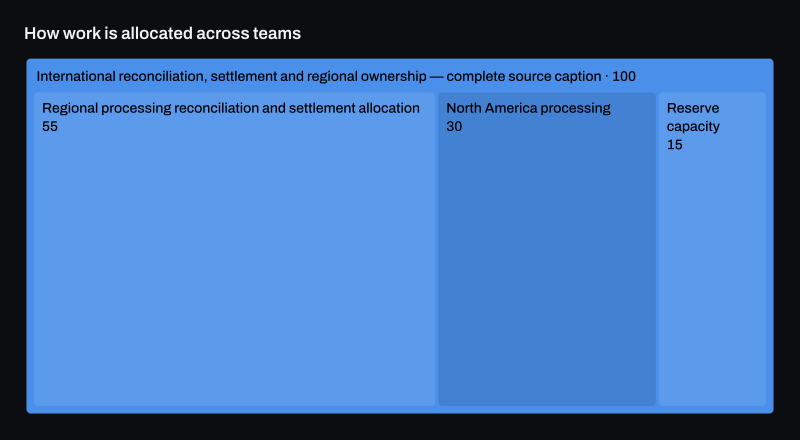
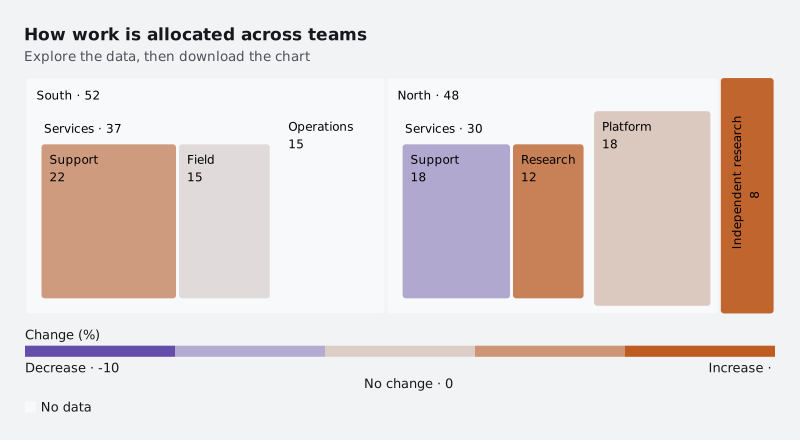
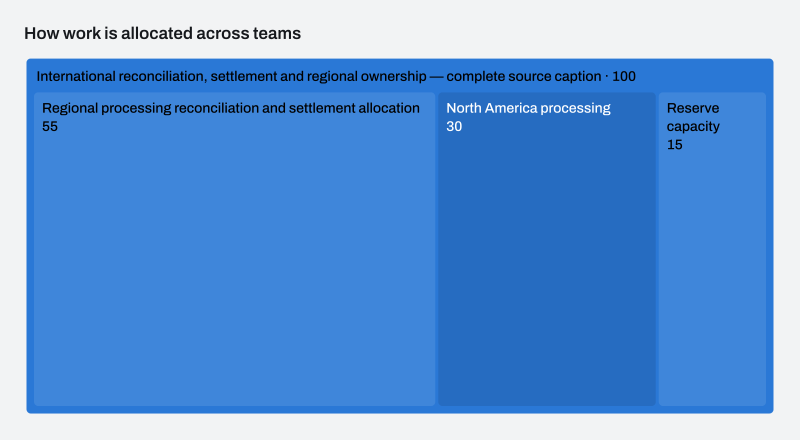
How work is allocated across teams

The interactive HTML page ChartForgeX writes for this chart. Hover for values, click legend items to hide or show series, use the keyboard to navigate, and right-click for export and reset. Where the chart can redraw a zoomed range, use the wheel to zoom, choose Pan to move the window, or choose Brush and drag to zoom to a range.

Build it in C#

This is the code for the chart above. Show setup adds the imports before it and the few lines that write SVG, PNG and HTML after it, so it reads as one program; the download is the complete console program, ready to run with the ChartForgeX package.
C# Program.cs Download
Loading source…

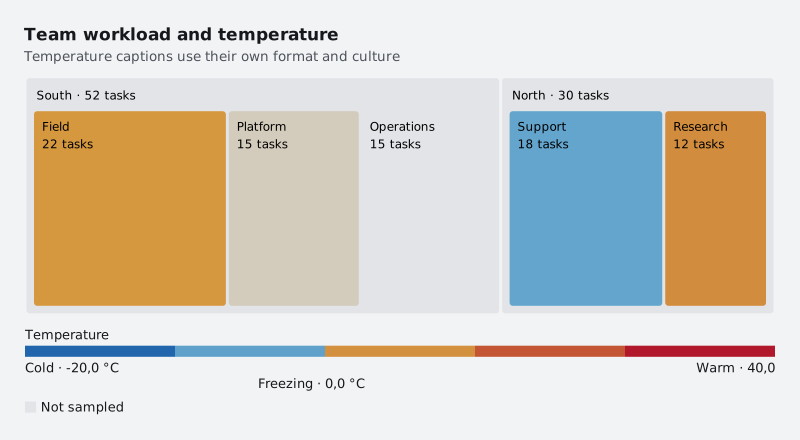
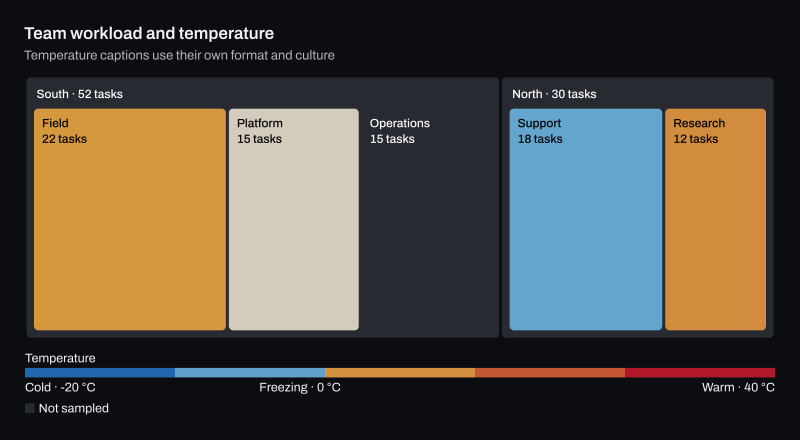
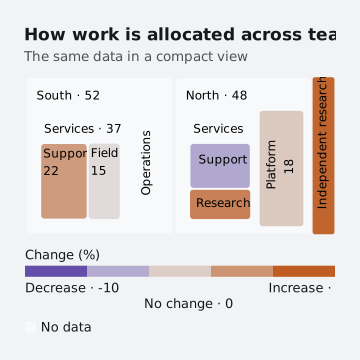
Variants

Options

Set these on chart.ConfigureTreemap(options => …). The full list is on the ChartTreemapOptions reference page.

OptionWhat it does
MinimumLabelFontSizeGets or sets an optional finite positive complete-caption font-size floor in logical pixels. Default: null.
LabelTrimmingGets or sets the final primary-caption overflow policy. Default: None, retaining complete-or-omitted names.
GroupPaddingGets or sets the non-negative padding inside each group, in pixels. Default: six.
GapGets or sets the non-negative gap between sibling rectangles, in pixels. Small cells bound their own gap. Default: three.
ShowGroupLabelsGets or sets whether measured group headers are reserved and drawn. Default: true.
ShowValuesGets or sets whether group and leaf captions include magnitudes. Labels and semantic values are retained. Default: true.
ColorScaleGets or sets the numeric color scale. When omitted, supplied color values use the theme's sequential ramp.
ColorDimensionGets the independent color measurement's name and number display policy.