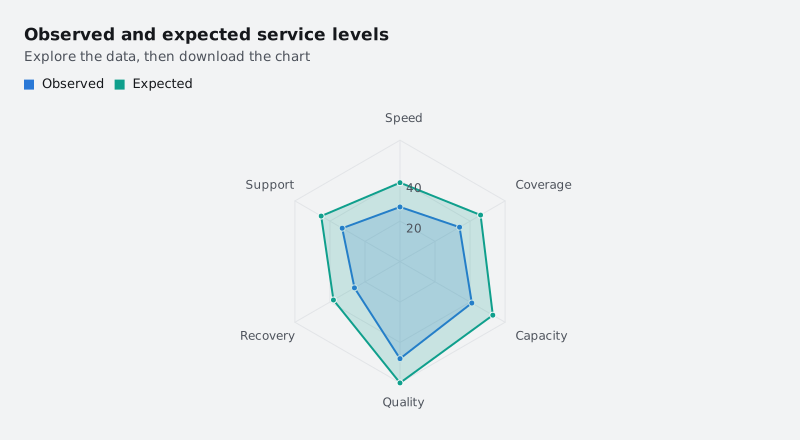
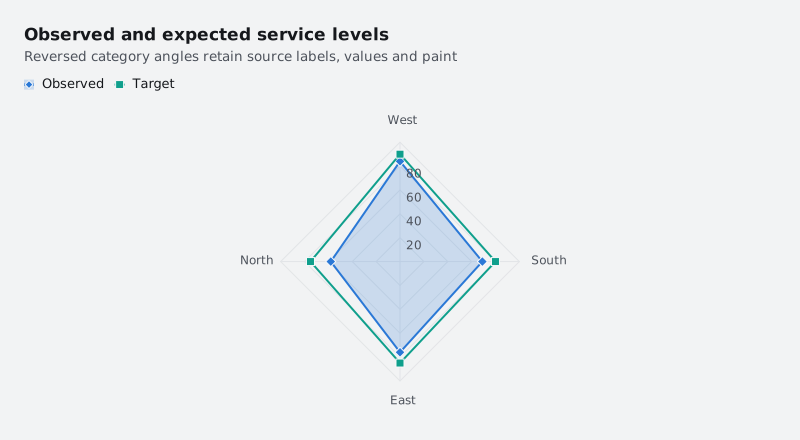
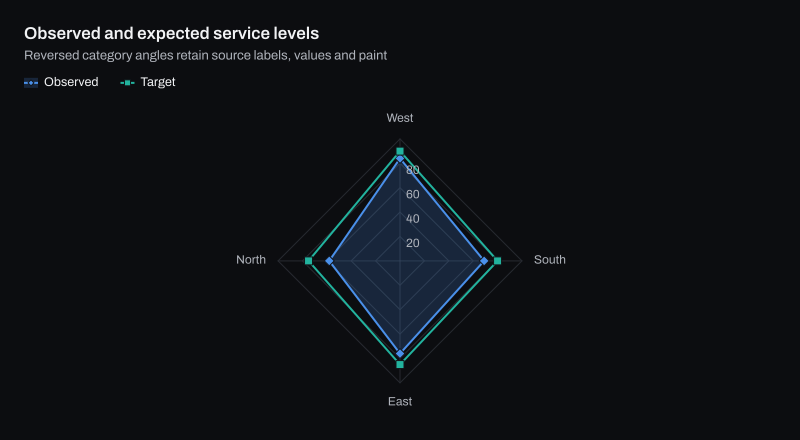
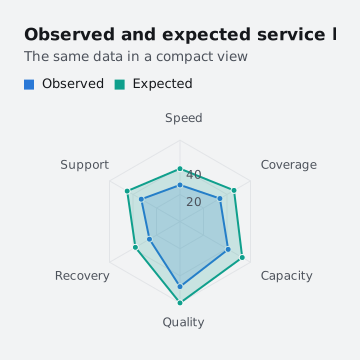
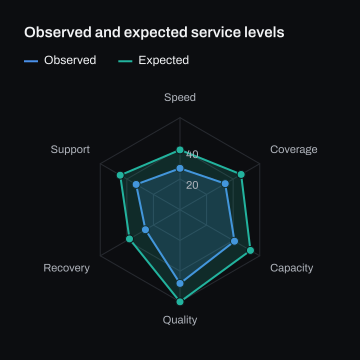
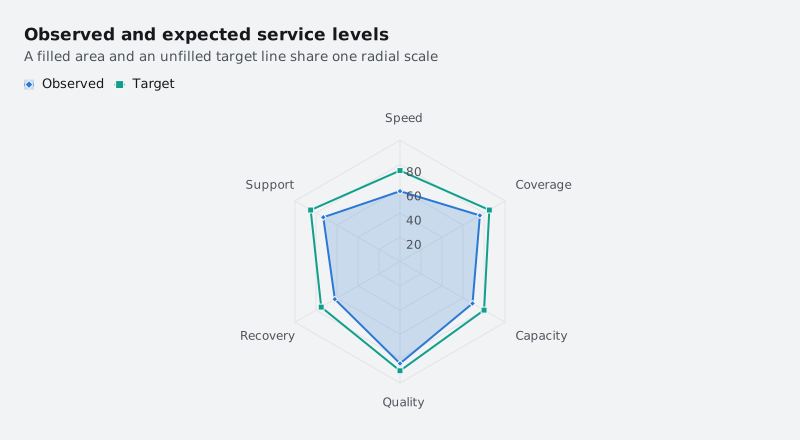
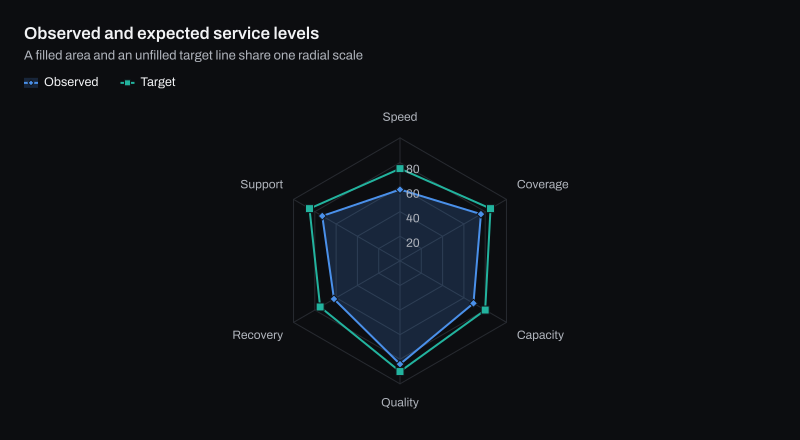
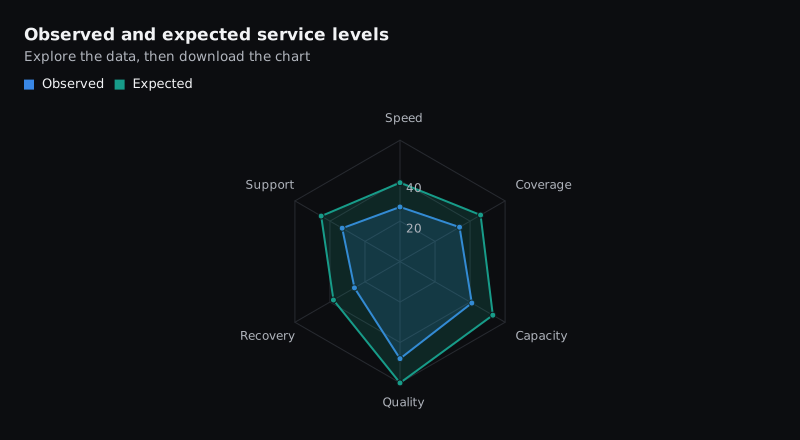
The interactive HTML page ChartForgeX writes for this chart. Hover for values, click legend items to hide or show series, use the keyboard to navigate, and right-click for export and reset. Where the chart can redraw a zoomed range, use the wheel to zoom, choose Pan to move the window, or choose Brush and drag to zoom to a range.
Build it in C#
This is the code for the chart above. Show setup adds the imports before it and the few lines that write SVG, PNG and HTML after it, so it reads as one program; the download is the complete console program, ready to run with the ChartForgeX package.
Gets or sets immutable outline-stroke overrides. Null uses the series color and width; zero width hides the outline while retaining the area, markers and observations. Dedicated and mixed radial layouts share these overrides.
Gets or sets closed-curve tension from zero through one. Null or zero preserves straight edges; positive values use cyclic cubic tangents through the observations.