Skip to content
ChartForgeX

Linear gauge examples in C#

Linear gauge examples rendered by ChartForgeX: a live chart, variants in light and dark themes, the C# source and the options to configure it.

All charts Progress and targetsGauge

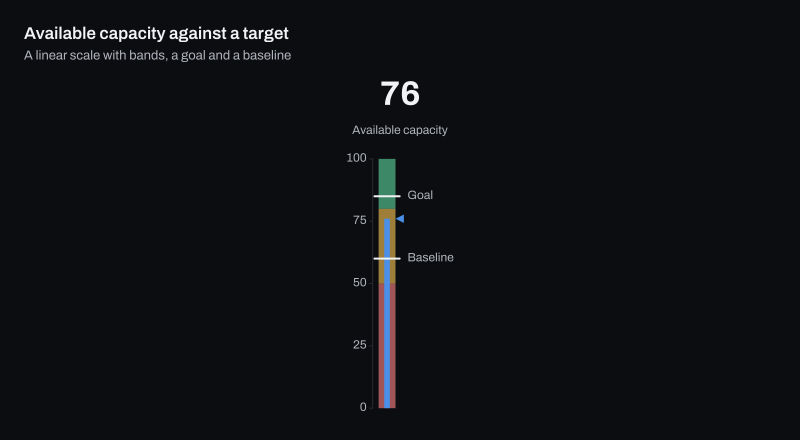
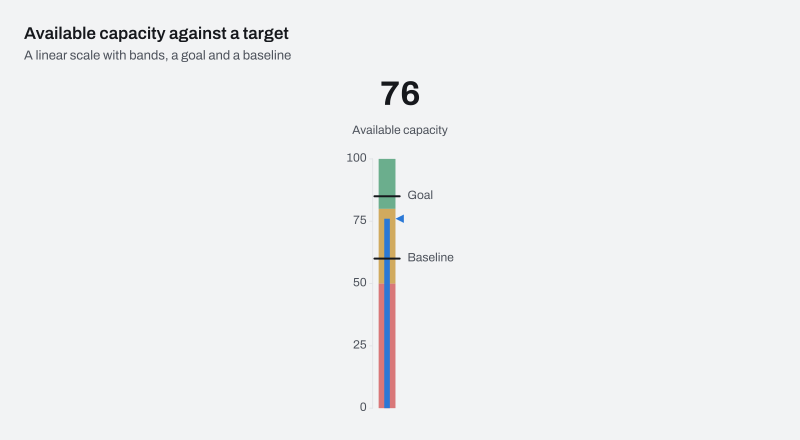
Available capacity against a target

The interactive HTML page ChartForgeX writes for this chart. Hover for values, click legend items to hide or show series, use the keyboard to navigate, and right-click for export and reset. Where the chart can redraw a zoomed range, use the wheel to zoom, choose Pan to move the window, or choose Brush and drag to zoom to a range.

Build it in C#

This is the code for the chart above. Show setup adds the imports before it and the few lines that write SVG, PNG and HTML after it, so it reads as one program; the download is the complete console program, ready to run with the ChartForgeX package.
C# Program.cs Download
Loading source…

Options

Set these on chart.ConfigureGauge(options => …). The full list is on the ChartGaugeOptions reference page.

OptionWhat it does
FormGets or sets the gauge form.
OrientationGets or sets the linear gauge direction. Horizontal places the minimum at the left; vertical places it at the bottom.
StartAngleDegreesGets or sets the radial scale's starting angle in degrees. Zero points right and positive angles turn clockwise.
SweepAngleDegreesGets or sets the radial scale's clockwise sweep in degrees, greater than zero and at most 360.
TickCountGets or sets the preferred generated tick ceiling. Null uses two radial or five linear ticks.
TickLabelsGets or sets a detached read-only snapshot of explicit tick values and captions in authored order.
BandGapGets or sets the total empty inset between band segments in logical pixels. Half is removed at each segment end; zero retains contiguous bands.
NeedleColorGets or sets an optional needle color. Null uses the measured value paint; it does not change the reading or semantic band state.