Skip to content
ChartForgeX

Hexbin heatmap examples in C#

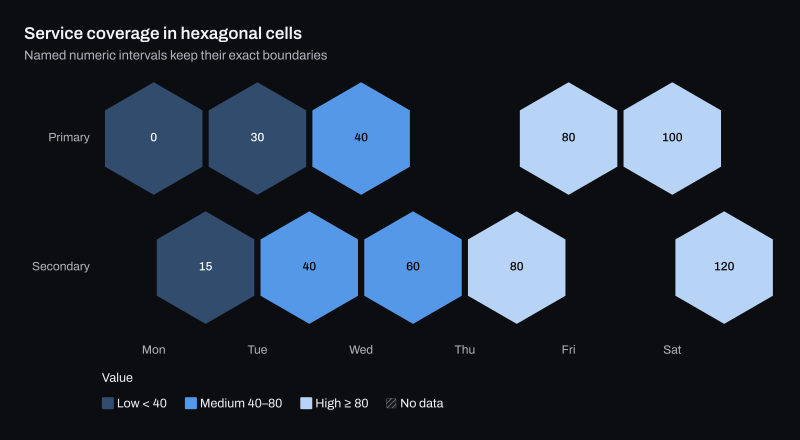
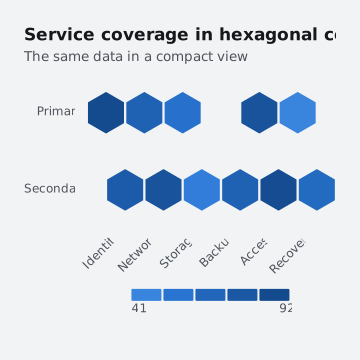
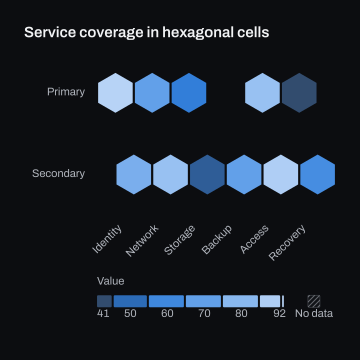
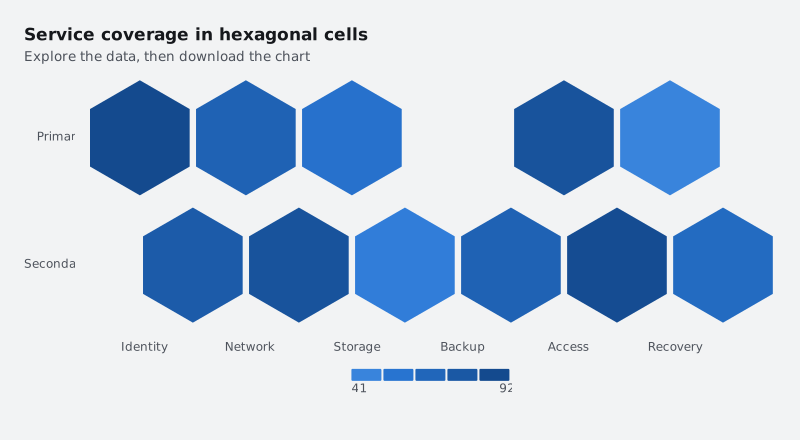
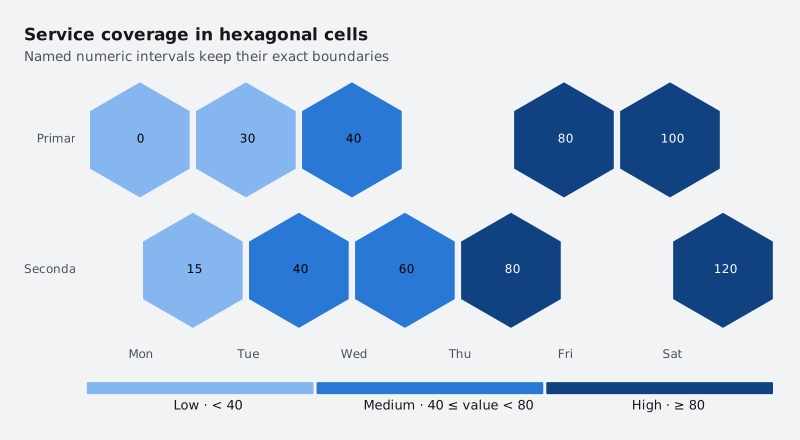
Hexbin heatmap examples rendered by ChartForgeX: a live chart, variants in light and dark themes, the C# source and the options to configure it.

All charts Matrices and mapsHexbinHeatmap

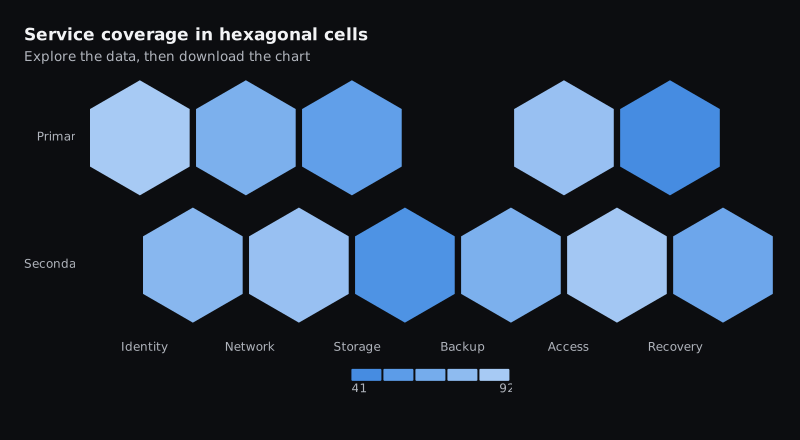
Service coverage in hexagonal cells

hexbin-heatmap.interactive.html SVG SVG Open live page Open live page C# program C# program
The interactive HTML page ChartForgeX writes for this chart. Hover for values, click legend items to hide or show series, use the keyboard to navigate, and right-click for export and reset. Where the chart can redraw a zoomed range, use the wheel to zoom, choose Pan to move the window, or choose Brush and drag to zoom to a range.

Build it in C#

This is the code for the chart above. Show setup adds the imports before it and the few lines that write SVG, PNG and HTML after it, so it reads as one program; the download is the complete console program, ready to run with the ChartForgeX package.
C# Program.cs Download
Loading source…

Variants

Options

Common Chart builder calls for this family. Every member is listed in the API reference.

MethodWhat it does
WithTitleSets the chart title.
WithXLabelsSets x-axis labels for one-based x values.
AddSeriesAttaches a configured series, preserving its stable identity and data ownership.
WithLegendSets whether the legend should be rendered.
WithDataLabelsSets chart-level data-label visibility. Explicit series overrides take precedence.
WithValueFormatSets the shared numeric display policy used by value labels, totals and numeric vertical axes.
ConfigureXAxisConfigures the primary horizontal axis.
ConfigureYAxisConfigures the primary vertical axis.