Skip to content
ChartForgeX

Calendar Heatmap examples in C#

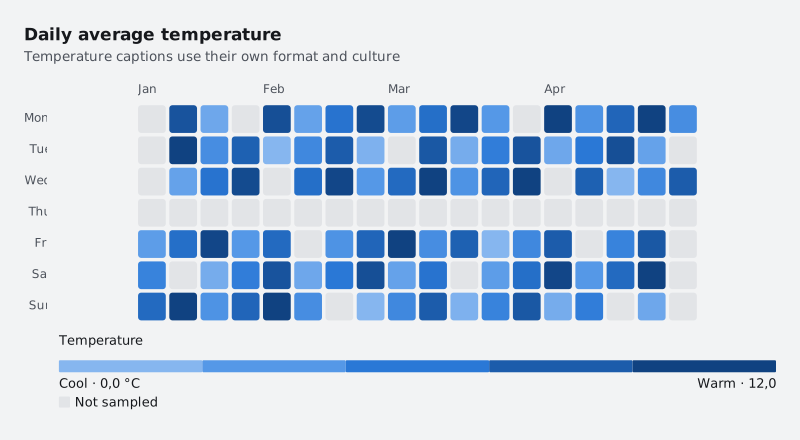
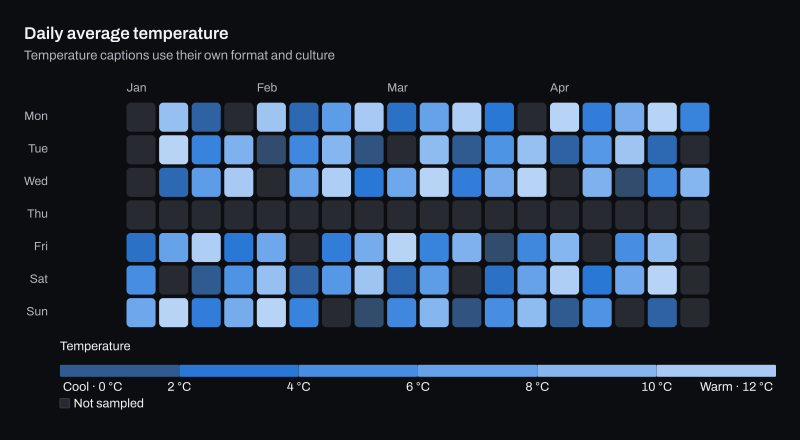
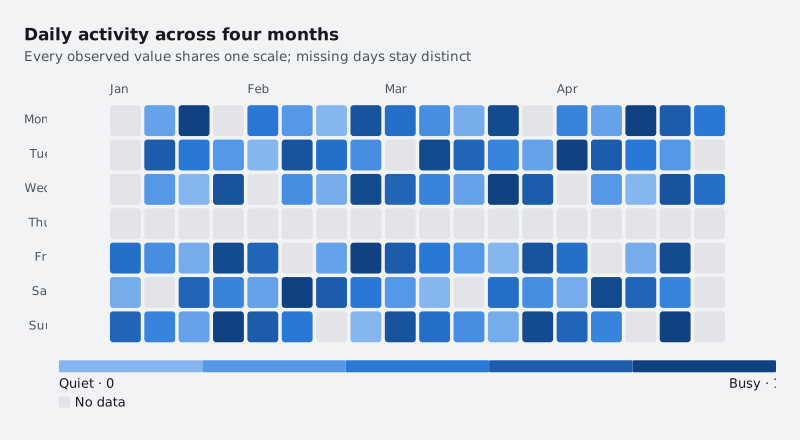
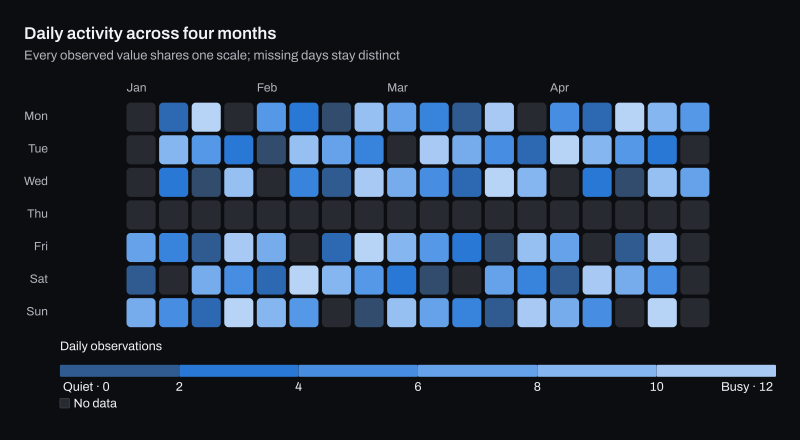
Calendar Heatmap examples rendered by ChartForgeX: a live chart, variants in light and dark themes, the C# source and the options to configure it.

All charts Matrices and mapsCalendarHeatmap

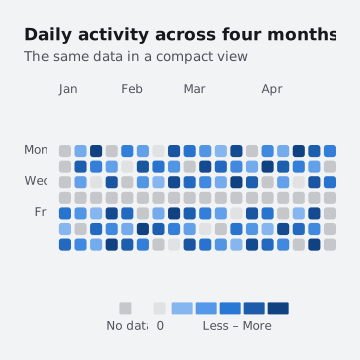
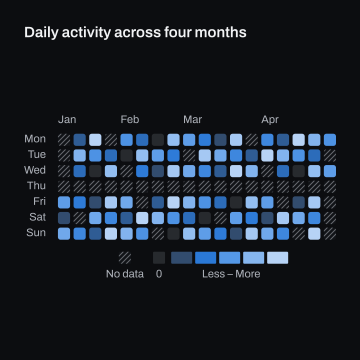
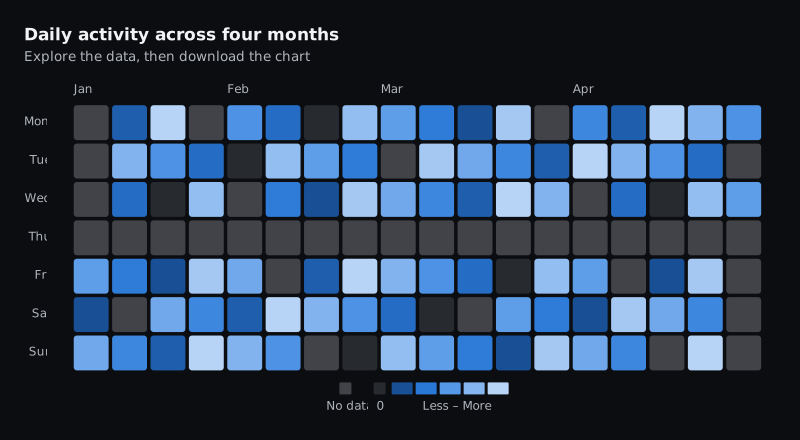
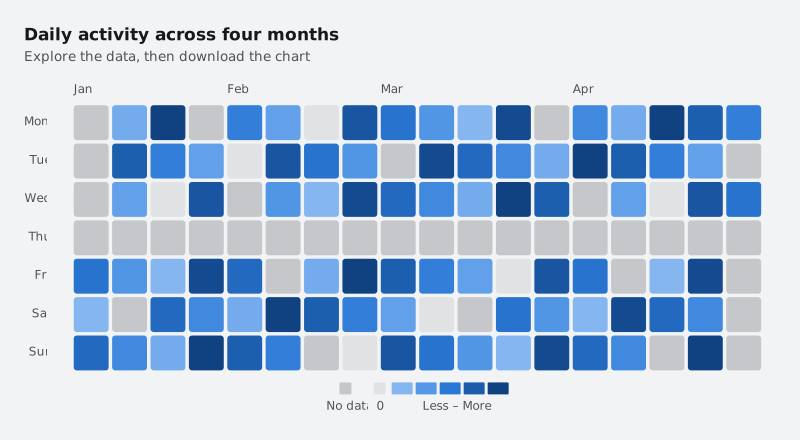
Daily activity across four months

calendar-heatmap.interactive.html SVG SVG Open live page Open live page C# program C# program
The interactive HTML page ChartForgeX writes for this chart. Hover for values, click legend items to hide or show series, use the keyboard to navigate, and right-click for export and reset. Where the chart can redraw a zoomed range, use the wheel to zoom, choose Pan to move the window, or choose Brush and drag to zoom to a range.

Build it in C#

This is the code for the chart above. Show setup adds the imports before it and the few lines that write SVG, PNG and HTML after it, so it reads as one program; the download is the complete console program, ready to run with the ChartForgeX package.

C# Program.cs Download
Loading source…

Variants

Options

Set these on chart.ConfigureCalendar(options => …). The full list is on the ChartCalendarOptions reference page.

OptionWhat it does
FirstDayOfWeekGets or sets the weekday in the top row. Weeks begin on this day. Default: Sunday.
DayNamesGets or sets seven non-empty weekday names indexed by DayOfWeek, Sunday first. Null uses invariant abbreviations. Both assignment and retrieval copy the names.
MonthNamesGets or sets twelve non-empty month names, January first. Null uses invariant abbreviations. Both assignment and retrieval copy the names.
CellSizeGets or sets a preferred cell size in pixels, between two and two hundred. Cells shrink to fit the plot. Null fills the plot; a preferred size takes precedence over MaximumCellSize.
MaximumCellSizeGets or sets the largest size, in pixels, cells grow to when filling the plot. Null leaves them unlimited.
GapGets or sets a cell gap from zero to twenty-four pixels. Null chooses 3.5 px, or 2.5 px above 32 weeks.