Skip to content
ChartForgeX

Box Plot examples in C#

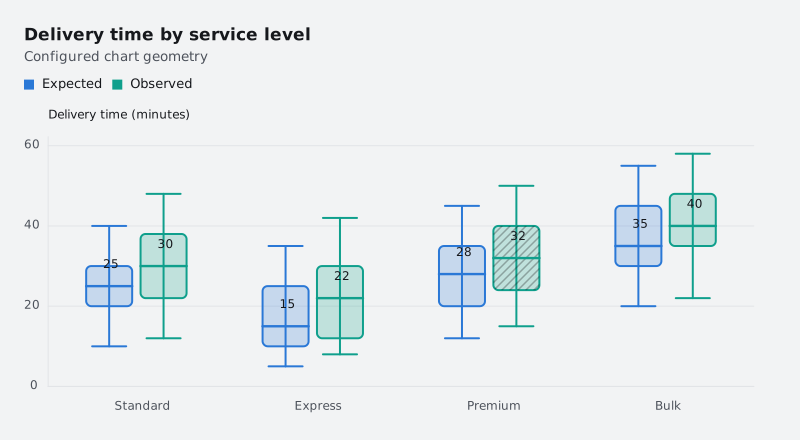
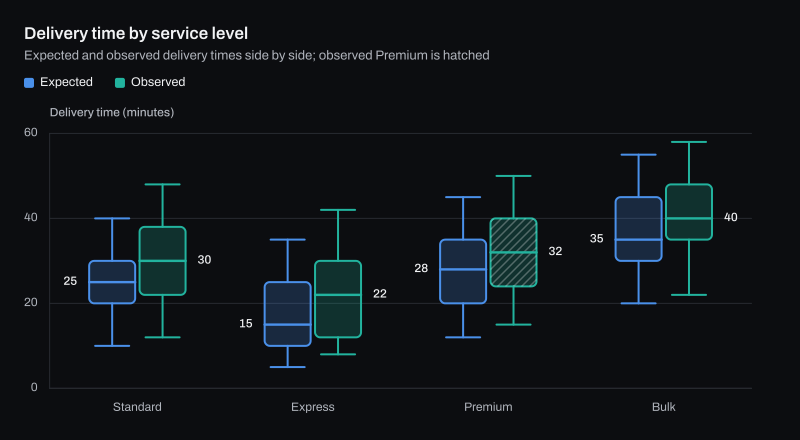
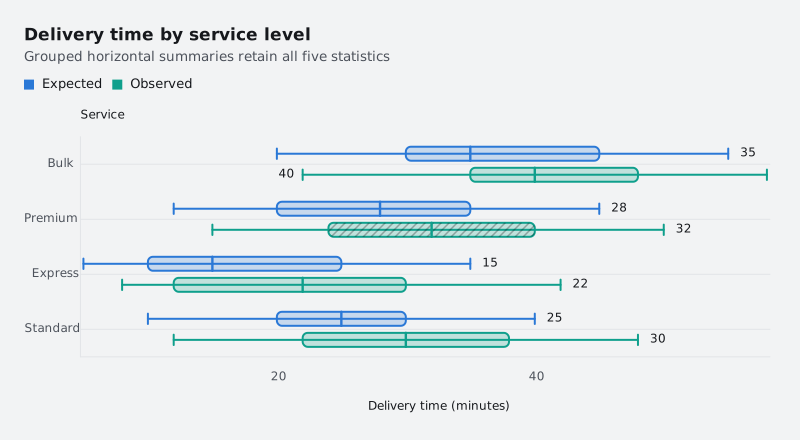
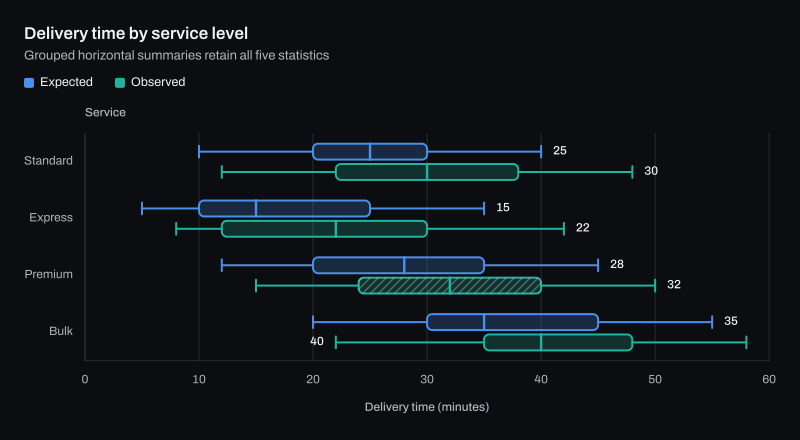
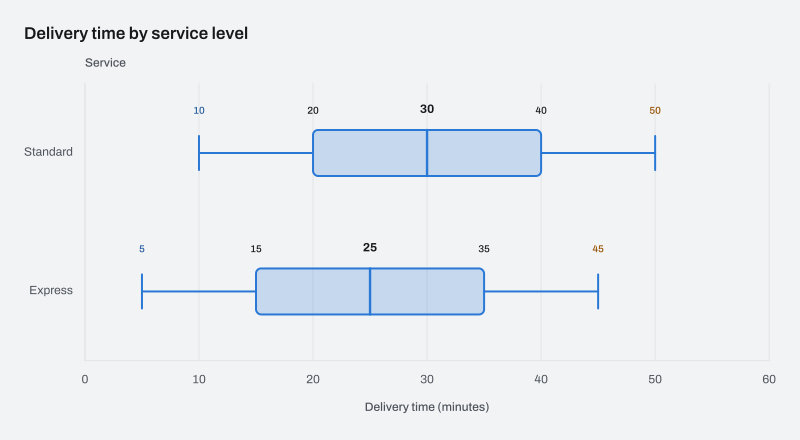
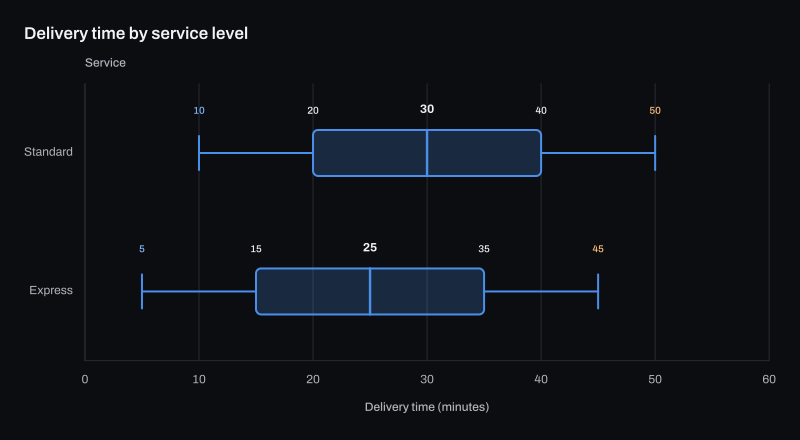
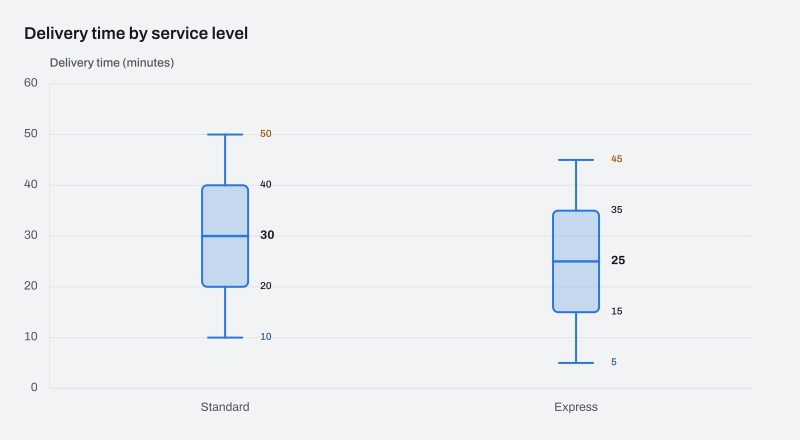
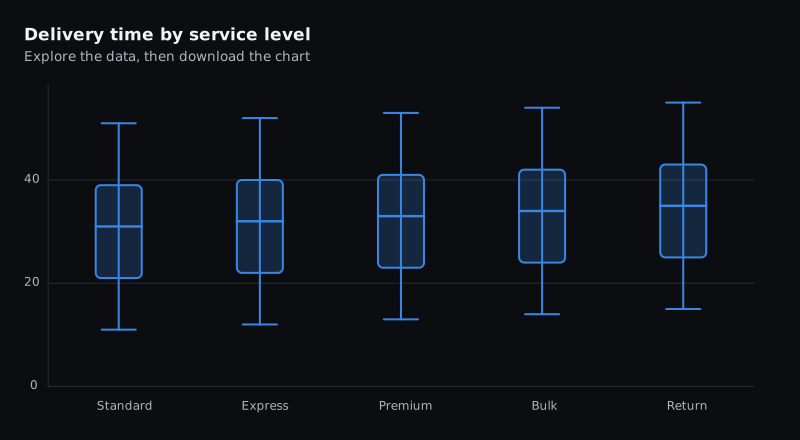
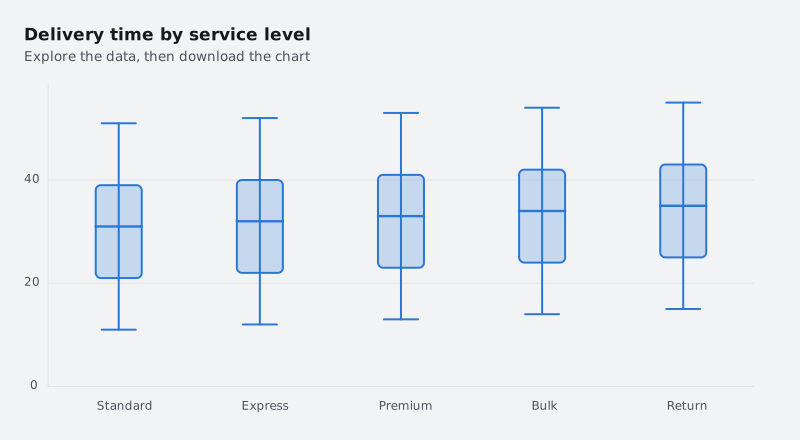
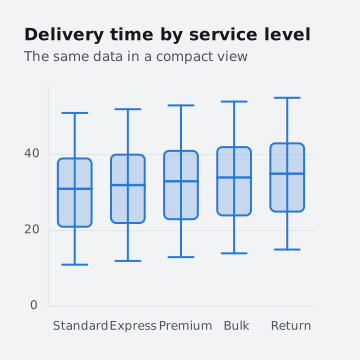
Box Plot examples rendered by ChartForgeX: a live chart, variants in light and dark themes, the C# source and the options to configure it.

All charts DistributionsBoxPlot

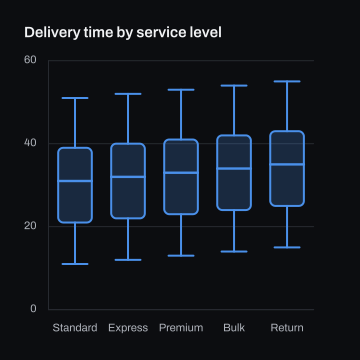
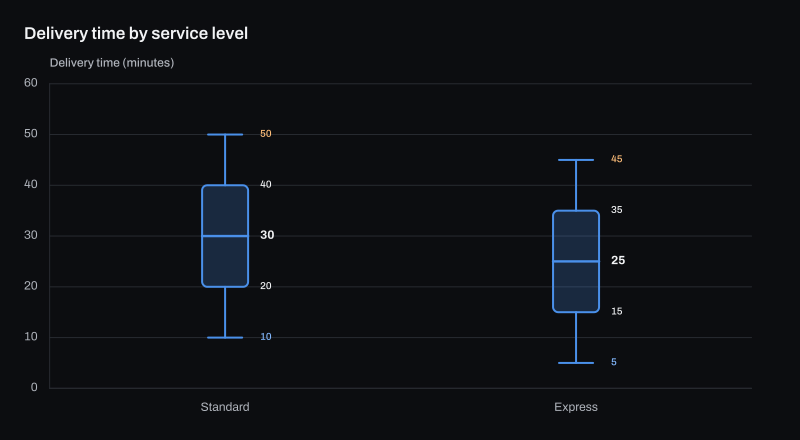
Delivery time by service level

The interactive HTML page ChartForgeX writes for this chart. Hover for values, click legend items to hide or show series, use the keyboard to navigate, and right-click for export and reset. Where the chart can redraw a zoomed range, use the wheel to zoom, choose Pan to move the window, or choose Brush and drag to zoom to a range.

Build it in C#

This is the code for the chart above. Show setup adds the imports before it and the few lines that write SVG, PNG and HTML after it, so it reads as one program; the download is the complete console program, ready to run with the ChartForgeX package.
C# Program.cs Download
Loading source…

Variants

Options

Set these on chart.ConfigureBoxPlot(options => …). The full list is on the ChartBoxPlotOptions reference page.

OptionWhat it does
LabelContentGets or sets whether labels show the legacy median heading or independently configured statistics. Default: Median.
StatisticLabelFormatterGets or sets the optional formatter for Statistics captions. Null uses the chart's numeric value format.
MinimumLabelGets the rendered lower-whisker caption settings in Statistics mode.
Q1LabelGets the first-quartile caption settings in Statistics mode.
MedianLabelGets the median caption settings in Statistics mode.
Q3LabelGets the third-quartile caption settings in Statistics mode.
MaximumLabelGets the rendered upper-whisker caption settings in Statistics mode.
OrientationGets or sets the value direction. Vertical is the default; horizontal uses X for values and Y for categories.