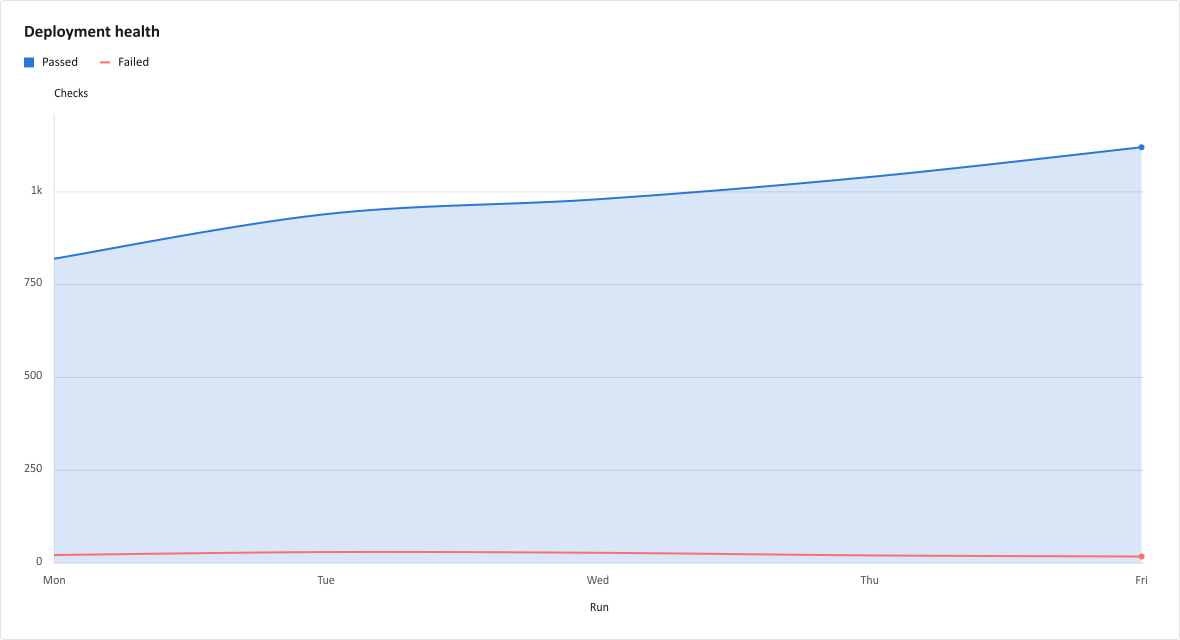
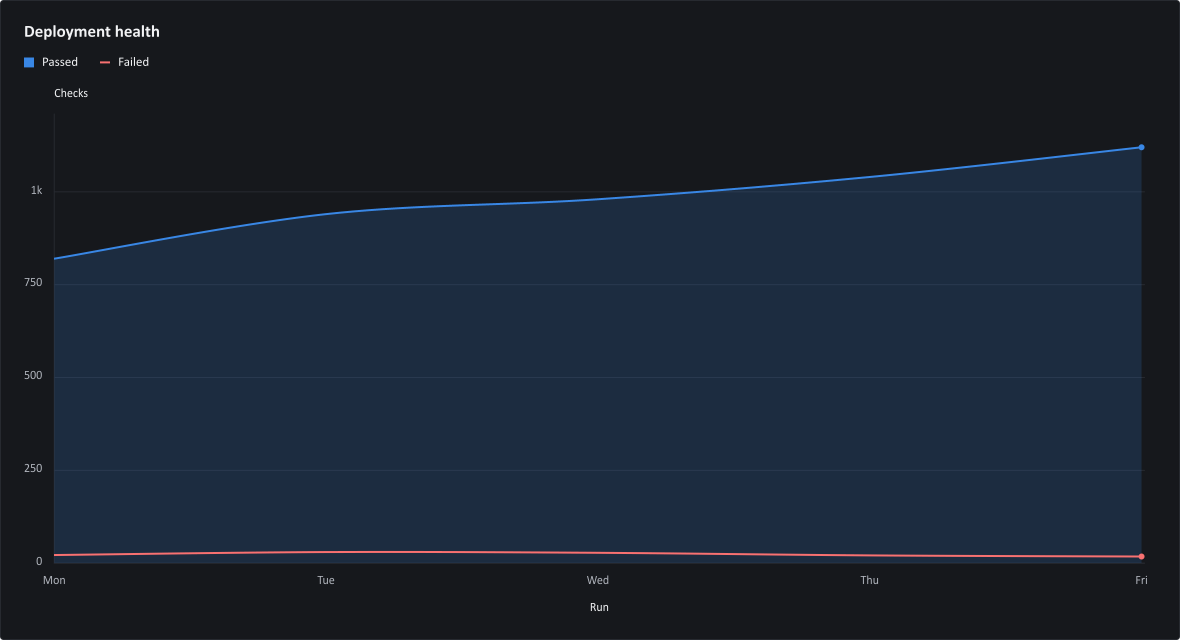
One typed definition renders to every surface. The output above is this program's SVG; the site adds WithThemeMode to show it in its light and dark themes.
Your first static chart
Render the same typed ChartForgeX chart as SVG, HTML, and PNG from one C# definition.
Describe the chart
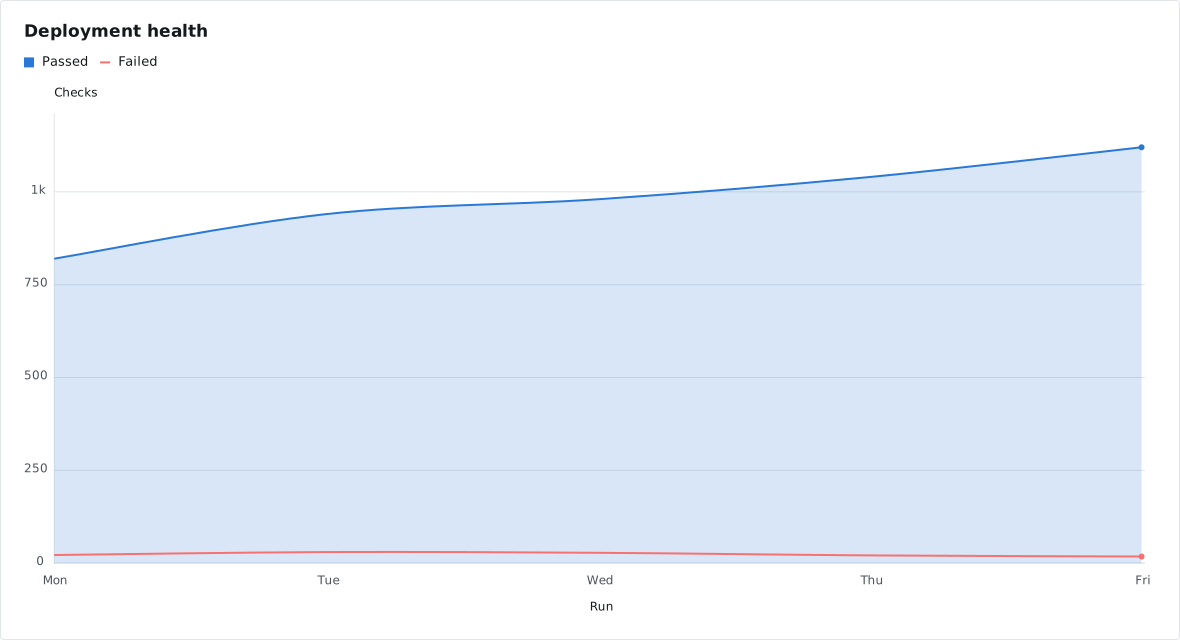
Create the chart once: a title, axis titles, a size and the category labels. Series draw in the order you add them, so the failed checks sit on top of the passed area.
using ChartForgeX;
using ChartForgeX.Core;
using ChartForgeX.Primitives;

var chart = Chart.Create()
    .WithTitle("Deployment health")
    .WithXAxis("Run")
    .WithYAxis("Checks")
    .WithSize(1180, 640)
    .WithXLabels("Mon", "Tue", "Wed", "Thu", "Fri")
    .AddSmoothArea("Passed", Points(820, 940, 980, 1040, 1120))
    .AddSmoothLine("Failed", Points(22, 30, 28, 21, 18),
        ChartColor.FromRgb(248, 113, 113));
Save each surface
To* methods return content, Save* methods write files, and Write* methods stream bytes. SVG is the highest-fidelity static target; HTML wraps inline SVG; PNG is useful for email and document pipelines.
chart.SaveSvg("deployment-health.svg");
chart.SaveHtml("deployment-health.html");
chart.SavePng("deployment-health.png");
Supply the points
A small helper turns plain values into points at x = 1, 2, 3 and so on, one for each category label.
static IEnumerable<ChartPoint> Points(params double[] values) {
    for (var index = 0; index < values.Length; index++) {
        yield return new ChartPoint(index + 1, values[index]);
    }
}