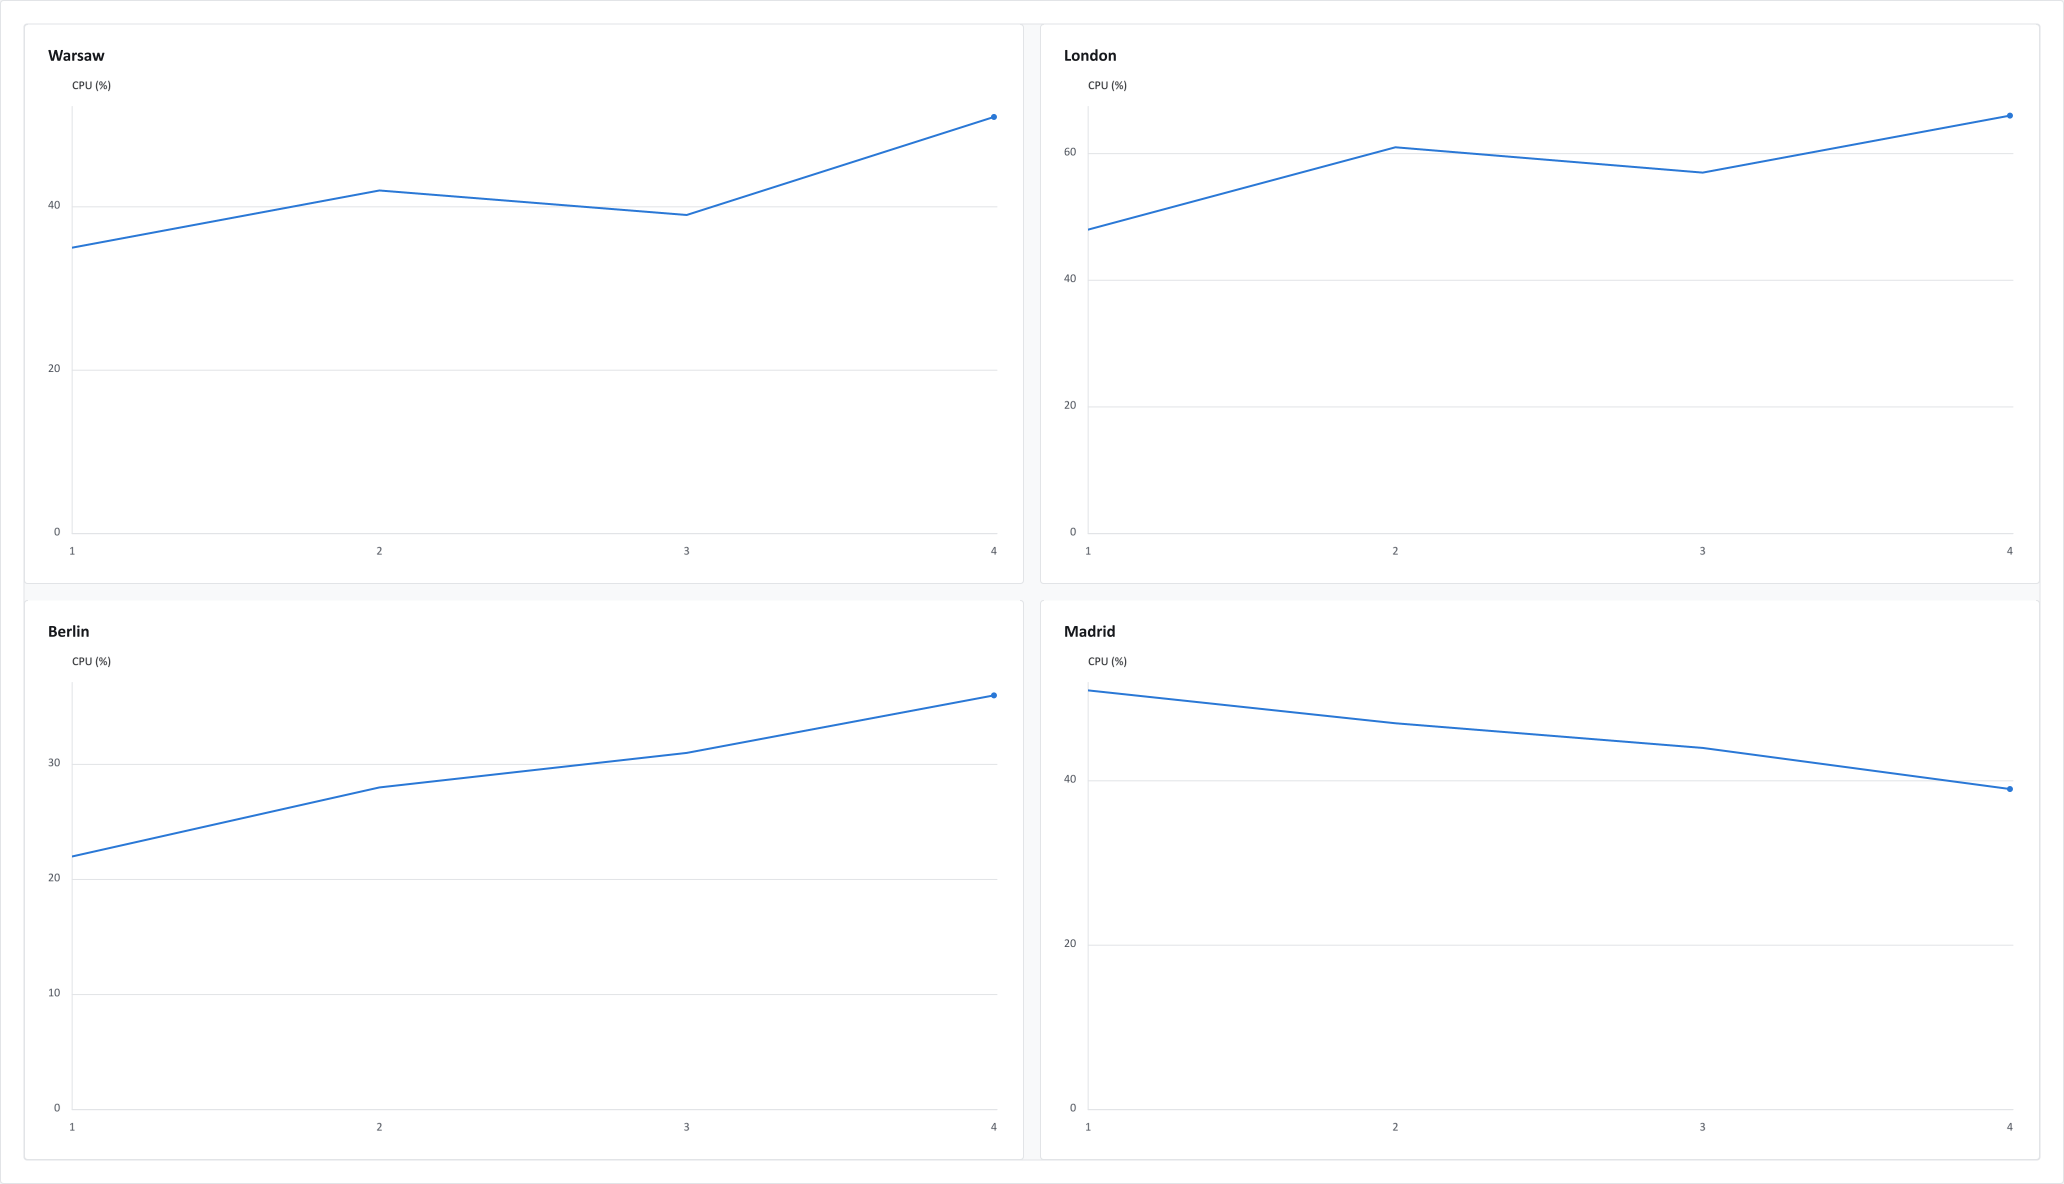
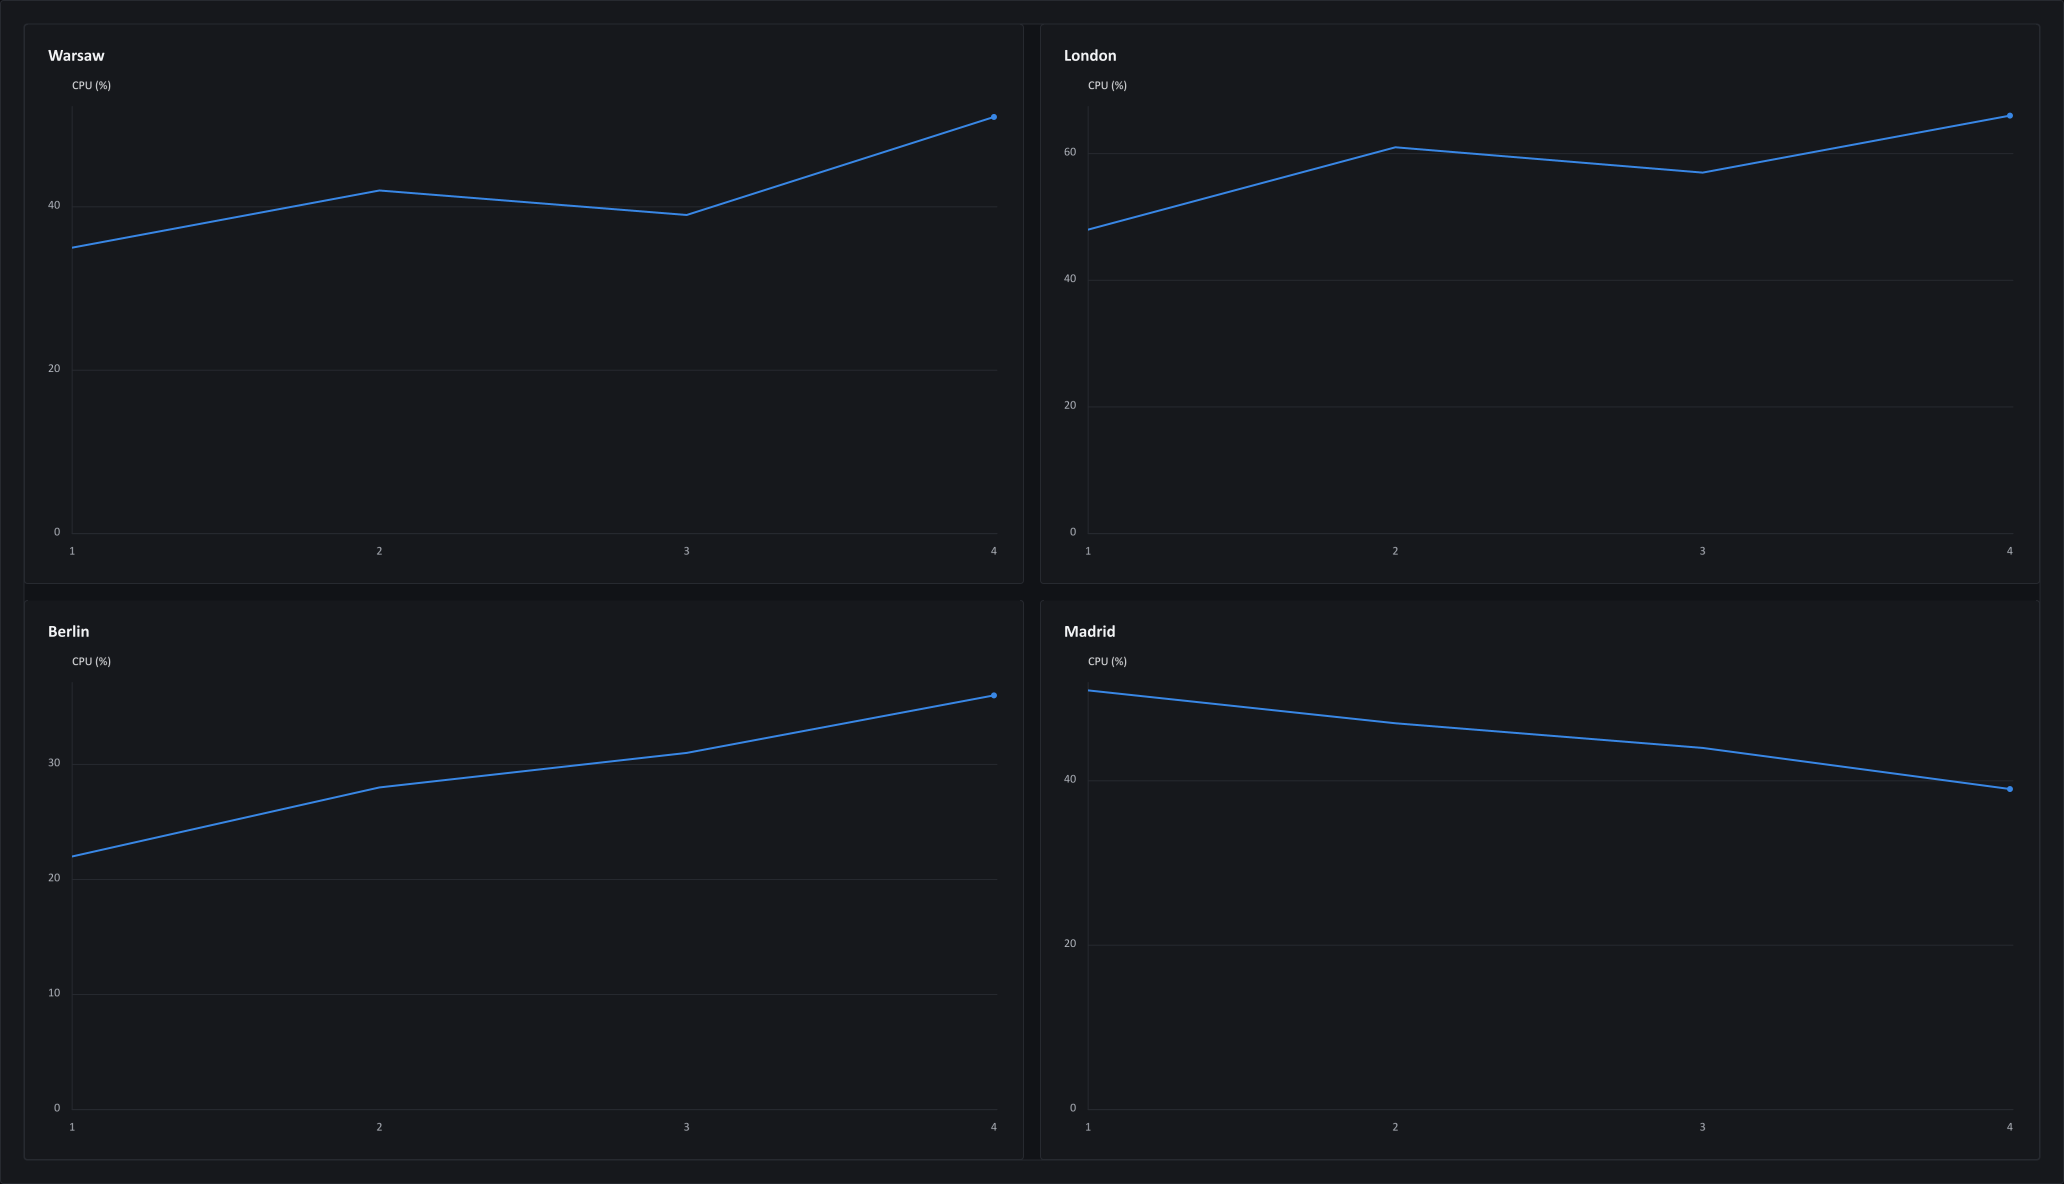
Typed records become one chart per site, laid out as a grid. The output above is this program's SVG; the site adds WithThemeMode to the grid, which themes every panel, to show it in its light and dark themes.
Small-multiple report grid
Facet typed records into a deterministic multi-panel chart report with shared axes and pages.
Load typed records
ChartDataset<T> keeps your own record type, so the chart reads properties instead of parallel arrays.
using ChartForgeX;
using ChartForgeX.Core;
using ChartForgeX.Data;

var samples = ChartDataset<CpuSample>.From(new CpuSample[] {
    new("Warsaw", 1, 35), new("Warsaw", 2, 42),
    new("Warsaw", 3, 39), new("Warsaw", 4, 51),
    new("London", 1, 48), new("London", 2, 61),
    new("London", 3, 57), new("London", 4, 66),
    new("Berlin", 1, 22), new("Berlin", 2, 28),
    new("Berlin", 3, 31), new("Berlin", 4, 36),
    new("Madrid", 1, 51), new("Madrid", 2, 47),
    new("Madrid", 3, 44), new("Madrid", 4, 39)
});
Facet into a grid
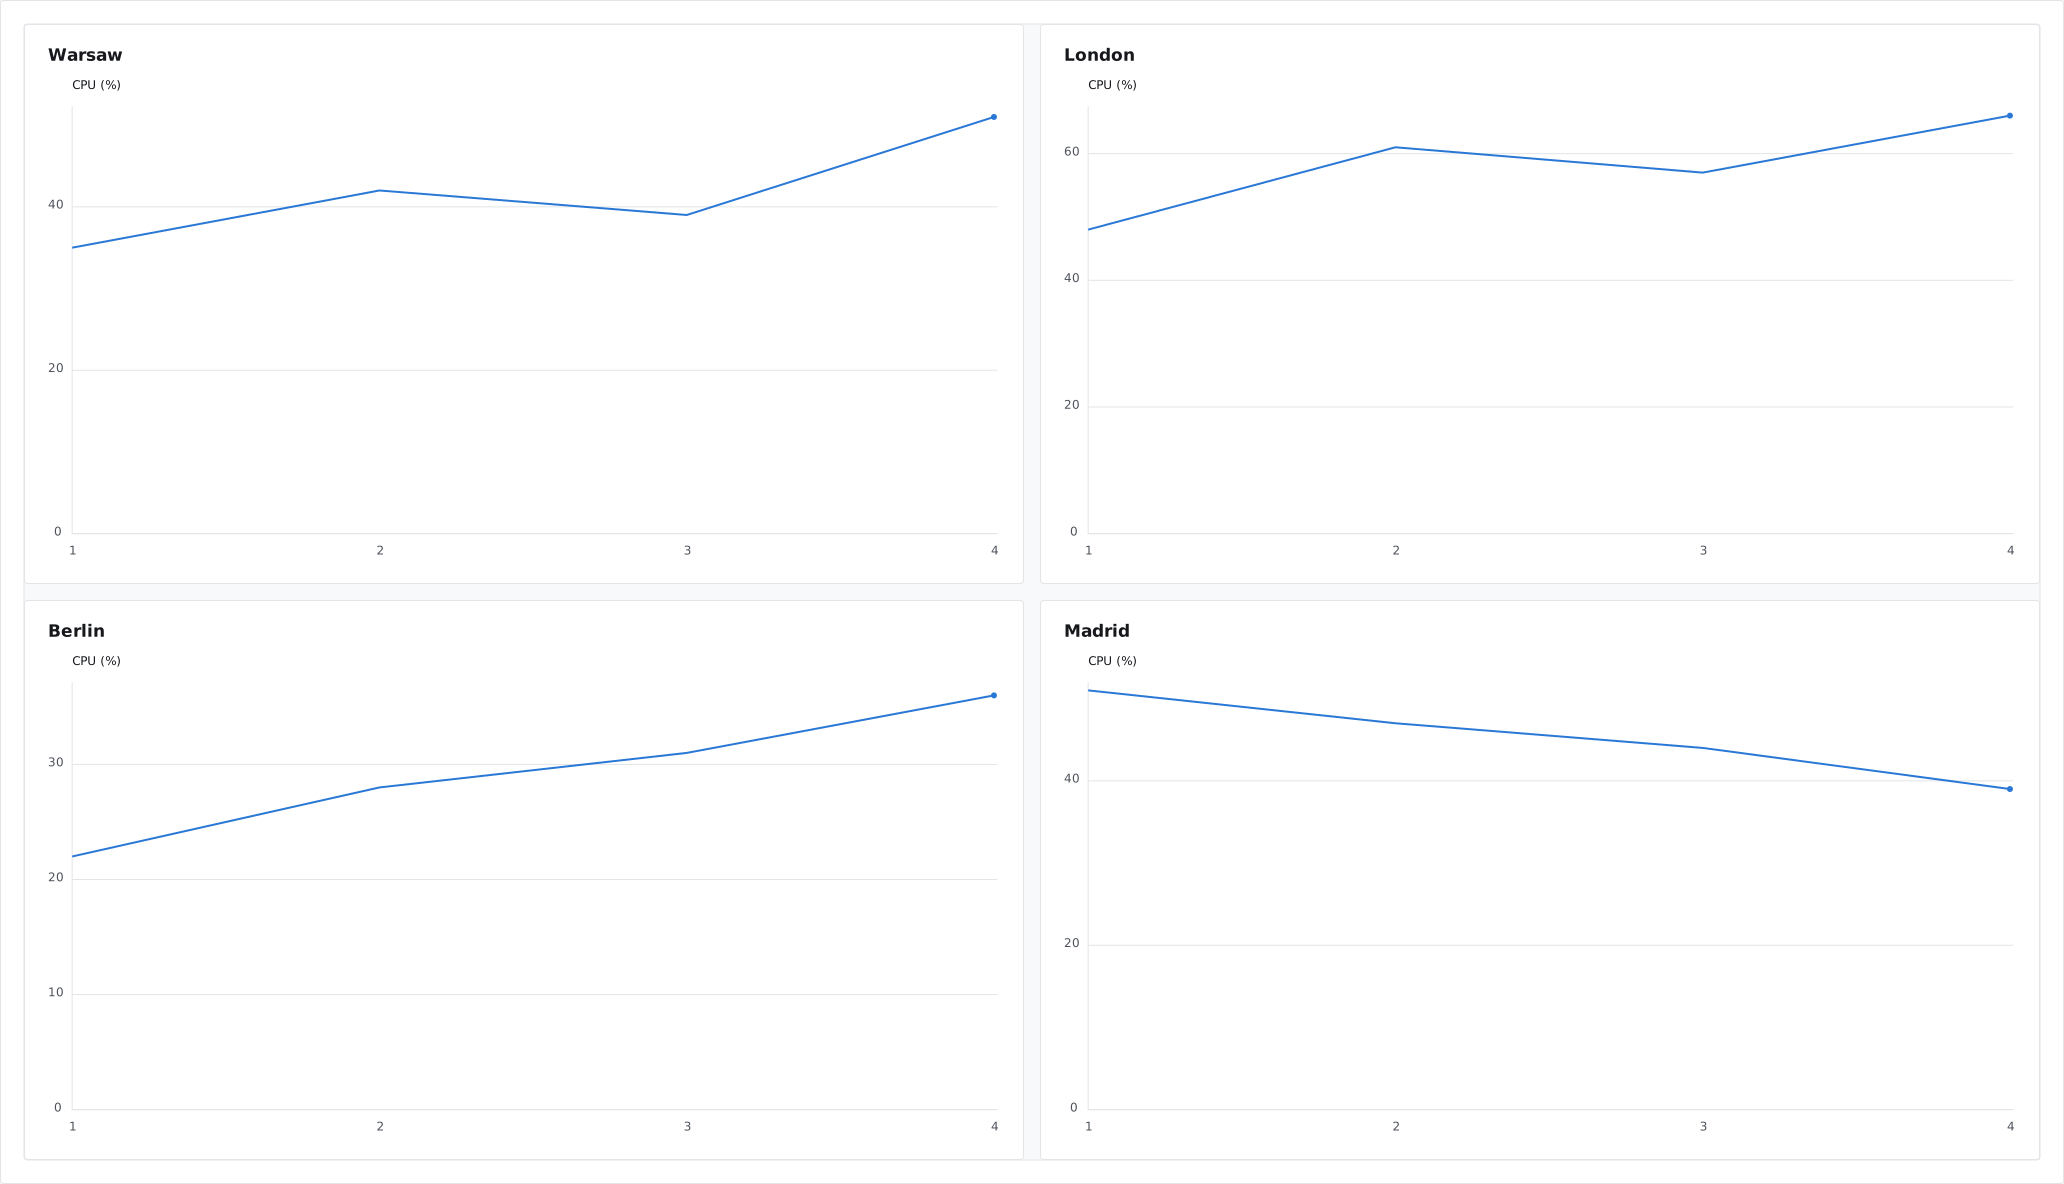
ChartGrid.FromFacets groups the records by a key and builds one chart per group with the factory you pass. Groups keep their input order.
var report = ChartGrid.FromFacets(
    samples,
    sample => sample.Site,
    (site, rows) => Chart.Create()
        .WithTitle(site)
        .WithYAxis("CPU (%)")
        .AddLine("CPU", rows,
            sample => sample.Minute, sample => sample.Cpu),
    columns: 2);
Save the report
The grid renders as one image, so a report, an email or a wiki page gets every panel in a single file.
report.SavePng("cpu-by-site.png");
report.SaveSvg("cpu-by-site.svg");
Declare the record
Any record or class works; the selectors above read its properties.
record CpuSample(string Site, double Minute, double Cpu);
Use ChartGrid for chart-only small multiples. Use visual blocks or a visual canvas when the report also needs exact facts, lists, or positioned artwork.