Preview
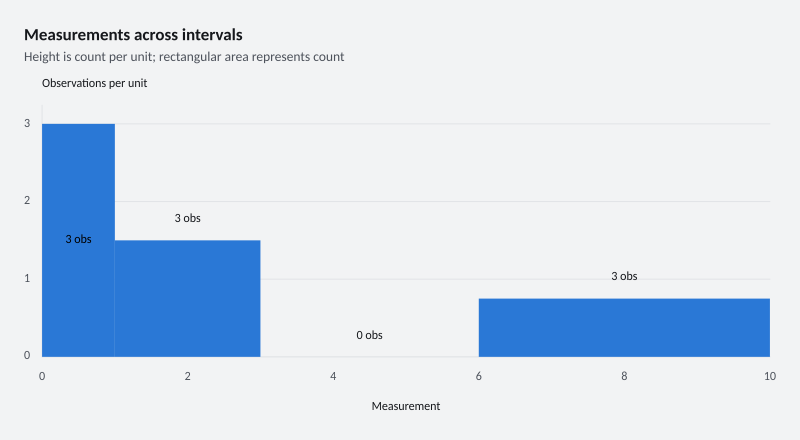
800 × 440 pixels
Create this example
Create a console project, add the ChartForgeX package, and replace Program.cs with this source. Run it to write SVG, PNG and HTML with the default system fonts.
For the same typography as the gallery, download the gallery-font recipe and copy the gallery’s fonts directory beside your program.
using System;
using System.Collections.Generic;
using System.Globalization;
using System.IO;
using System.Linq;
using ChartForgeX.Core;
using ChartForgeX.Primitives;
using ChartForgeX.Rendering;
using ChartForgeX.Themes;
using ChartForgeX.Topology;
using ChartForgeX.Typography;
using ChartForgeX.VisualArtifacts;
using ChartForgeX.VisualBlocks;

var mode = VisualThemeMode.Light;
var theme = VisualTheme.Graphite();
var model = HistogramRecipe.Create("density", mode);
var context = new VisualRenderContext(
    new VisualLayoutOptions(new VisualSize(800, 440)), theme, mode,
    new VisualFrame("Measurements across intervals", "Height is count per unit; rectangular area represents count", showLegend: false, showSurface: false));
var prepared = model.Prepare(context);
File.WriteAllText("visual.svg", prepared.ToSvg());
File.WriteAllBytes("visual.png", prepared.ToPng());
File.WriteAllText("visual.html", prepared.ToArtifact("example", VisualArtifactKind.Chart).ToHtmlPage());

/// <summary>Counts, density, signed sums or means over the same explicit unequal measurement intervals.</summary>
public static class HistogramRecipe {
    public static Chart Create(string variant = "wide", VisualThemeMode mode = VisualThemeMode.Light) {
        var aggregation = variant.StartsWith("compact-", StringComparison.Ordinal) ? variant.Substring(8) : variant;
        if (aggregation == "compact") aggregation = "wide";
        var layout = ChartHistogramBinLayout.FromBoundaries(new[] { 0d, 1, 3, 6, 10 });
        var chart = Chart.Create().WithXAxis("Measurement").WithDataLabels();
        chart.Options.XAxis.WithBounds(0, 10);
        ChartSeries observations;
        if (aggregation is "wide" or "density") {
            observations = ChartSeries.CreateHistogram(new ChartSeriesId("observations"), "Observations",
                new[] { .2, .4, .8, 1.2, 1.8, 2.5, 6.1, 7.5, 9 }, layout,
                aggregation == "density" ? ChartHistogramEncoding.Density : ChartHistogramEncoding.Value);
            chart.WithYAxis(aggregation == "density" ? "Observations per unit" : "Observation count");
            foreach (var bin in observations.HistogramBins) observations.WithPointLabel(bin.Index, bin.Count + " obs");
        } else if (aggregation is "sum" or "mean") {
            observations = ChartSeries.CreateHistogram(new ChartSeriesId("quantity"), "Quantity",
                new[] { new ChartPoint(.2, 10), new ChartPoint(.4, -4), new ChartPoint(1.2, 8),
                    new ChartPoint(2.5, 12), new ChartPoint(6.1, -4), new ChartPoint(9, -8) }, layout,
                aggregation == "sum" ? ChartHistogramAggregation.Sum : ChartHistogramAggregation.Mean);
            chart.WithYAxis(aggregation == "sum" ? "Total quantity" : "Mean quantity");
        } else throw new ArgumentOutOfRangeException(nameof(variant));
        return chart.AddSeries(observations);
    }
}
using System;
using System.Collections.Generic;
using System.Globalization;
using System.IO;
using System.Linq;
using ChartForgeX.Core;
using ChartForgeX.Primitives;
using ChartForgeX.Rendering;
using ChartForgeX.Themes;
using ChartForgeX.Topology;
using ChartForgeX.Typography;
using ChartForgeX.VisualArtifacts;
using ChartForgeX.VisualBlocks;

var mode = VisualThemeMode.Dark;
var theme = VisualTheme.Graphite();
var model = HistogramRecipe.Create("density", mode);
var context = new VisualRenderContext(
    new VisualLayoutOptions(new VisualSize(800, 440)), theme, mode,
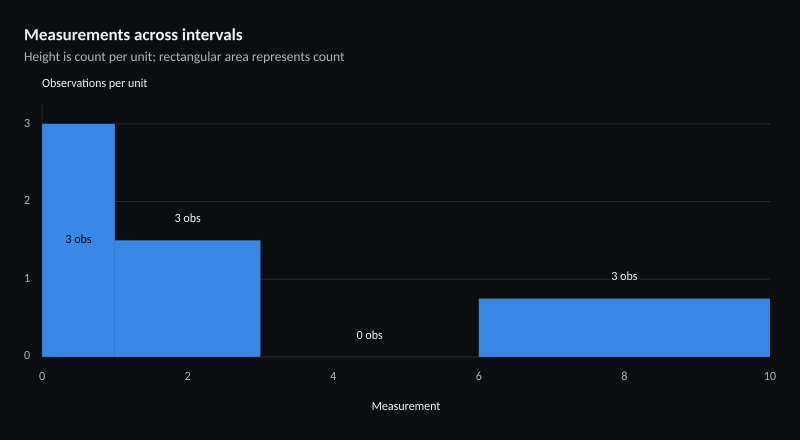
    new VisualFrame("Measurements across intervals", "Height is count per unit; rectangular area represents count", showLegend: false, showSurface: false));
var prepared = model.Prepare(context);
File.WriteAllText("visual.svg", prepared.ToSvg());
File.WriteAllBytes("visual.png", prepared.ToPng());
File.WriteAllText("visual.html", prepared.ToArtifact("example", VisualArtifactKind.Chart).ToHtmlPage());

/// <summary>Counts, density, signed sums or means over the same explicit unequal measurement intervals.</summary>
public static class HistogramRecipe {
    public static Chart Create(string variant = "wide", VisualThemeMode mode = VisualThemeMode.Light) {
        var aggregation = variant.StartsWith("compact-", StringComparison.Ordinal) ? variant.Substring(8) : variant;
        if (aggregation == "compact") aggregation = "wide";
        var layout = ChartHistogramBinLayout.FromBoundaries(new[] { 0d, 1, 3, 6, 10 });
        var chart = Chart.Create().WithXAxis("Measurement").WithDataLabels();
        chart.Options.XAxis.WithBounds(0, 10);
        ChartSeries observations;
        if (aggregation is "wide" or "density") {
            observations = ChartSeries.CreateHistogram(new ChartSeriesId("observations"), "Observations",
                new[] { .2, .4, .8, 1.2, 1.8, 2.5, 6.1, 7.5, 9 }, layout,
                aggregation == "density" ? ChartHistogramEncoding.Density : ChartHistogramEncoding.Value);
            chart.WithYAxis(aggregation == "density" ? "Observations per unit" : "Observation count");
            foreach (var bin in observations.HistogramBins) observations.WithPointLabel(bin.Index, bin.Count + " obs");
        } else if (aggregation is "sum" or "mean") {
            observations = ChartSeries.CreateHistogram(new ChartSeriesId("quantity"), "Quantity",
                new[] { new ChartPoint(.2, 10), new ChartPoint(.4, -4), new ChartPoint(1.2, 8),
                    new ChartPoint(2.5, 12), new ChartPoint(6.1, -4), new ChartPoint(9, -8) }, layout,
                aggregation == "sum" ? ChartHistogramAggregation.Sum : ChartHistogramAggregation.Mean);
            chart.WithYAxis(aggregation == "sum" ? "Total quantity" : "Mean quantity");
        } else throw new ArgumentOutOfRangeException(nameof(variant));
        return chart.AddSeries(observations);
    }
}