Preview
800 × 440 pixels
Create this example
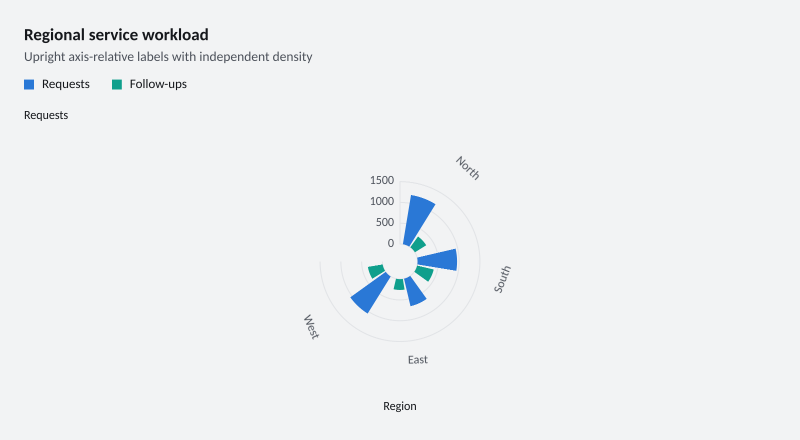
Create a console project, add the ChartForgeX package, and replace Program.cs with this source. Run it to write SVG, PNG and HTML with the default system fonts.
For the same typography as the gallery, download the gallery-font recipe and copy the gallery’s fonts directory beside your program.
using System;
using System.Collections.Generic;
using System.Globalization;
using System.IO;
using System.Linq;
using ChartForgeX.Core;
using ChartForgeX.Primitives;
using ChartForgeX.Rendering;
using ChartForgeX.Themes;
using ChartForgeX.Topology;
using ChartForgeX.Typography;
using ChartForgeX.VisualArtifacts;
using ChartForgeX.VisualBlocks;

var mode = VisualThemeMode.Light;
var theme = VisualTheme.Graphite();
var model = RadialColumnRecipe.Create("axis-labels", mode);
var context = new VisualRenderContext(
    new VisualLayoutOptions(new VisualSize(800, 440)), theme, mode,
    new VisualFrame("Regional service workload", "Upright axis-relative labels with independent density", showLegend: null, showSurface: false));
var prepared = model.Prepare(context);
File.WriteAllText("visual.svg", prepared.ToSvg());
File.WriteAllBytes("visual.png", prepared.ToPng());
File.WriteAllText("visual.html", prepared.ToArtifact("example", VisualArtifactKind.Chart).ToHtmlPage());

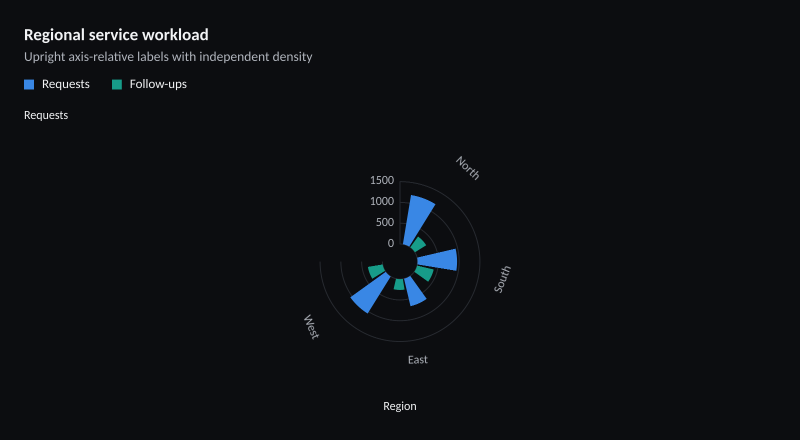
/// <summary>Regional requests and follow-ups encoded as numeric radial columns.</summary>
public static class RadialColumnRecipe {
    /// <summary>Creates radial columns with optional normalized stacking or explicit axis-caption density.</summary>
    public static Chart Create(string variant = "wide", VisualThemeMode mode = VisualThemeMode.Light) {
        if (variant is not ("wide" or "compact" or "sparse" or "options" or "compact-options" or "axis-labels" or "compact-axis-labels" or "all-labels" or "compact-all-labels"))
            throw new ArgumentOutOfRangeException(nameof(variant));
        if (variant is "all-labels" or "compact-all-labels") return AllLabels();
        var requests = new ChartSeries(new ChartSeriesId("requests"), "Requests", ChartSeriesKind.RadialColumn, Points(1200, 950, 680, 1050));
        var followUps = new ChartSeries(new ChartSeriesId("follow-ups"), "Follow-ups", ChartSeriesKind.RadialColumn, Points(320, 410, 260, 360));
        var chart = Chart.Create().WithXLabels("North", "South", "East", "West")
            .WithRadialGeometry(new ChartRadialGeometryOptions(-90, 180, .22, .22, .15))
            .AddSeries(requests).AddSeries(followUps).WithDataLabels().WithDataLabelPlacement(ChartDataLabelPlacement.Inside)
            .WithValueFormat(ChartValueFormat.Number("0.##", System.Globalization.CultureInfo.InvariantCulture));
        if (variant is "options" or "compact-options") {
            requests.WithStackGroup("work").WithNormalization(100);
            followUps.WithStackGroup("work").WithNormalization(100).WithPointFillPattern(1, ChartFillPattern.DiagonalForward);
            chart.WithRadialGeometry(new ChartRadialGeometryOptions(-90, 180, .22, .22, .15, cornerRadius: 6))
                .WithYAxisBounds(0, 100).WithXAxis("Region").WithYAxis("Share of regional workload (%)")
                .ConfigureXAxis(axis => axis.LabelAngle = -30).ConfigureYAxis(axis => axis.LabelAngle = 30);
        } else {
            chart.WithYAxisBounds(0, 1500);
        }
        if (variant is "axis-labels" or "compact-axis-labels") {
            chart.WithXAxis("Region").WithYAxis("Requests")
                .ConfigureXAxis(axis => { axis.LabelOrientation = ChartAxisLabelOrientation.Parallel; axis.LabelAngle = 10; axis.LabelDensity = ChartLabelDensity.Relaxed; })
                .ConfigureYAxis(axis => { axis.LabelOrientation = ChartAxisLabelOrientation.Perpendicular; axis.LabelDensity = ChartLabelDensity.Dense; });
        }
        return chart;
    }

    private static Chart AllLabels() {
        var requests = new ChartSeries(new ChartSeriesId("requests"), "Requests", ChartSeriesKind.RadialColumn,
            Enumerable.Range(1, 20).Select(index => new ChartPoint(index, 500 + index * 20)));
        var chart = Chart.Create().WithXLabels(Enumerable.Range(1, 20).Select(index => "Region " + index + " request volume").ToArray())
            .WithRadialGeometry(new ChartRadialGeometryOptions(-75, 195, .2, .25, .1))
            .WithYAxisBounds(0, 1500).WithDataLabels(false).WithXAxis("All region captions; overlaps are intentional")
            .ConfigureXAxis(axis => axis.LabelDensity = ChartLabelDensity.All).AddSeries(requests)
            .WithValueFormat(ChartValueFormat.Number("0.##", System.Globalization.CultureInfo.InvariantCulture));
        chart.Options.YAxis.Visible = false;
        return chart;
    }

    private static ChartPoint[] Points(params double[] values) => values.Select((value, index) => new ChartPoint(index + 1, value)).ToArray();
}
using System;
using System.Collections.Generic;
using System.Globalization;
using System.IO;
using System.Linq;
using ChartForgeX.Core;
using ChartForgeX.Primitives;
using ChartForgeX.Rendering;
using ChartForgeX.Themes;
using ChartForgeX.Topology;
using ChartForgeX.Typography;
using ChartForgeX.VisualArtifacts;
using ChartForgeX.VisualBlocks;

var mode = VisualThemeMode.Dark;
var theme = VisualTheme.Graphite();
var model = RadialColumnRecipe.Create("axis-labels", mode);
var context = new VisualRenderContext(
    new VisualLayoutOptions(new VisualSize(800, 440)), theme, mode,
    new VisualFrame("Regional service workload", "Upright axis-relative labels with independent density", showLegend: null, showSurface: false));
var prepared = model.Prepare(context);
File.WriteAllText("visual.svg", prepared.ToSvg());
File.WriteAllBytes("visual.png", prepared.ToPng());
File.WriteAllText("visual.html", prepared.ToArtifact("example", VisualArtifactKind.Chart).ToHtmlPage());

/// <summary>Regional requests and follow-ups encoded as numeric radial columns.</summary>
public static class RadialColumnRecipe {
    /// <summary>Creates radial columns with optional normalized stacking or explicit axis-caption density.</summary>
    public static Chart Create(string variant = "wide", VisualThemeMode mode = VisualThemeMode.Light) {
        if (variant is not ("wide" or "compact" or "sparse" or "options" or "compact-options" or "axis-labels" or "compact-axis-labels" or "all-labels" or "compact-all-labels"))
            throw new ArgumentOutOfRangeException(nameof(variant));
        if (variant is "all-labels" or "compact-all-labels") return AllLabels();
        var requests = new ChartSeries(new ChartSeriesId("requests"), "Requests", ChartSeriesKind.RadialColumn, Points(1200, 950, 680, 1050));
        var followUps = new ChartSeries(new ChartSeriesId("follow-ups"), "Follow-ups", ChartSeriesKind.RadialColumn, Points(320, 410, 260, 360));
        var chart = Chart.Create().WithXLabels("North", "South", "East", "West")
            .WithRadialGeometry(new ChartRadialGeometryOptions(-90, 180, .22, .22, .15))
            .AddSeries(requests).AddSeries(followUps).WithDataLabels().WithDataLabelPlacement(ChartDataLabelPlacement.Inside)
            .WithValueFormat(ChartValueFormat.Number("0.##", System.Globalization.CultureInfo.InvariantCulture));
        if (variant is "options" or "compact-options") {
            requests.WithStackGroup("work").WithNormalization(100);
            followUps.WithStackGroup("work").WithNormalization(100).WithPointFillPattern(1, ChartFillPattern.DiagonalForward);
            chart.WithRadialGeometry(new ChartRadialGeometryOptions(-90, 180, .22, .22, .15, cornerRadius: 6))
                .WithYAxisBounds(0, 100).WithXAxis("Region").WithYAxis("Share of regional workload (%)")
                .ConfigureXAxis(axis => axis.LabelAngle = -30).ConfigureYAxis(axis => axis.LabelAngle = 30);
        } else {
            chart.WithYAxisBounds(0, 1500);
        }
        if (variant is "axis-labels" or "compact-axis-labels") {
            chart.WithXAxis("Region").WithYAxis("Requests")
                .ConfigureXAxis(axis => { axis.LabelOrientation = ChartAxisLabelOrientation.Parallel; axis.LabelAngle = 10; axis.LabelDensity = ChartLabelDensity.Relaxed; })
                .ConfigureYAxis(axis => { axis.LabelOrientation = ChartAxisLabelOrientation.Perpendicular; axis.LabelDensity = ChartLabelDensity.Dense; });
        }
        return chart;
    }

    private static Chart AllLabels() {
        var requests = new ChartSeries(new ChartSeriesId("requests"), "Requests", ChartSeriesKind.RadialColumn,
            Enumerable.Range(1, 20).Select(index => new ChartPoint(index, 500 + index * 20)));
        var chart = Chart.Create().WithXLabels(Enumerable.Range(1, 20).Select(index => "Region " + index + " request volume").ToArray())
            .WithRadialGeometry(new ChartRadialGeometryOptions(-75, 195, .2, .25, .1))
            .WithYAxisBounds(0, 1500).WithDataLabels(false).WithXAxis("All region captions; overlaps are intentional")
            .ConfigureXAxis(axis => axis.LabelDensity = ChartLabelDensity.All).AddSeries(requests)
            .WithValueFormat(ChartValueFormat.Number("0.##", System.Globalization.CultureInfo.InvariantCulture));
        chart.Options.YAxis.Visible = false;
        return chart;
    }

    private static ChartPoint[] Points(params double[] values) => values.Select((value, index) => new ChartPoint(index + 1, value)).ToArray();
}