Preview
360 × 360 pixels
Create this example
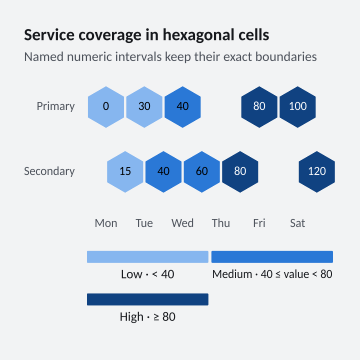
Create a console project, add the ChartForgeX package, and replace Program.cs with this source. Run it to write SVG, PNG and HTML with the default system fonts.
For the same typography as the gallery, download the gallery-font recipe and copy the gallery’s fonts directory beside your program.
using System;
using System.Collections.Generic;
using System.Globalization;
using System.IO;
using System.Linq;
using ChartForgeX.Core;
using ChartForgeX.Primitives;
using ChartForgeX.Rendering;
using ChartForgeX.Themes;
using ChartForgeX.Topology;
using ChartForgeX.Typography;
using ChartForgeX.VisualArtifacts;
using ChartForgeX.VisualBlocks;

var mode = VisualThemeMode.Light;
var theme = VisualTheme.Graphite();
var model = HexbinHeatmapColorScaleRecipe.Create("compact-color-scale", mode);
var context = new VisualRenderContext(
    new VisualLayoutOptions(new VisualSize(360, 360)), theme, mode,
    new VisualFrame("Service coverage in hexagonal cells", "Named numeric intervals keep their exact boundaries", showLegend: null, showSurface: false));
var prepared = model.Prepare(context);
File.WriteAllText("visual.svg", prepared.ToSvg());
File.WriteAllBytes("visual.png", prepared.ToPng());
File.WriteAllText("visual.html", prepared.ToArtifact("example", VisualArtifactKind.Chart).ToHtmlPage());

/// <summary>Groups numeric hexbin measurements into named color bands.</summary>
public static class HexbinHeatmapColorScaleRecipe {
    /// <summary>Creates low, medium and high measurement bands.</summary>
    public static Chart Create(string variant = "color-scale", VisualThemeMode mode = VisualThemeMode.Light) {
        if (variant is not ("color-scale" or "compact-color-scale")) throw new ArgumentOutOfRangeException(nameof(variant));
        var colors = VisualTheme.Graphite().Resolve(mode);
        return Chart.Create().WithXLabels("Mon", "Tue", "Wed", "Thu", "Fri", "Sat").WithDataLabels()
            .AddHexbinHeatmapRow("Primary", new double?[] { 0, 30, 40, null, 80, 100 }, id: new ChartSeriesId("primary-measurements"))
            .AddHexbinHeatmapRow("Secondary", new double?[] { 15, 40, 60, 80, null, 120 }, id: new ChartSeriesId("secondary-measurements"))
            .WithHeatmapColorScale(ChartColorScale.Discrete(new[] {
                new ChartColorBand(40, colors.SequentialRamp[0], "Low"),
                new ChartColorBand(80, colors.SequentialRamp[colors.SequentialRamp.Count / 2], "Medium"),
                new ChartColorBand(null, colors.SequentialRamp[colors.SequentialRamp.Count - 1], "High")
            })).WithValueFormat(ChartValueFormat.Number("0.##", CultureInfo.InvariantCulture));
    }
}
using System;
using System.Collections.Generic;
using System.Globalization;
using System.IO;
using System.Linq;
using ChartForgeX.Core;
using ChartForgeX.Primitives;
using ChartForgeX.Rendering;
using ChartForgeX.Themes;
using ChartForgeX.Topology;
using ChartForgeX.Typography;
using ChartForgeX.VisualArtifacts;
using ChartForgeX.VisualBlocks;

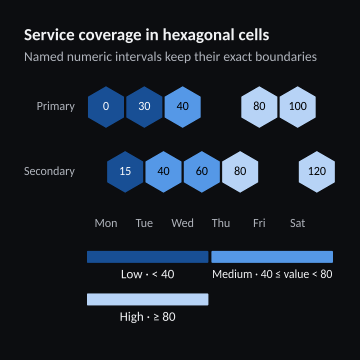
var mode = VisualThemeMode.Dark;
var theme = VisualTheme.Graphite();
var model = HexbinHeatmapColorScaleRecipe.Create("compact-color-scale", mode);
var context = new VisualRenderContext(
    new VisualLayoutOptions(new VisualSize(360, 360)), theme, mode,
    new VisualFrame("Service coverage in hexagonal cells", "Named numeric intervals keep their exact boundaries", showLegend: null, showSurface: false));
var prepared = model.Prepare(context);
File.WriteAllText("visual.svg", prepared.ToSvg());
File.WriteAllBytes("visual.png", prepared.ToPng());
File.WriteAllText("visual.html", prepared.ToArtifact("example", VisualArtifactKind.Chart).ToHtmlPage());

/// <summary>Groups numeric hexbin measurements into named color bands.</summary>
public static class HexbinHeatmapColorScaleRecipe {
    /// <summary>Creates low, medium and high measurement bands.</summary>
    public static Chart Create(string variant = "color-scale", VisualThemeMode mode = VisualThemeMode.Light) {
        if (variant is not ("color-scale" or "compact-color-scale")) throw new ArgumentOutOfRangeException(nameof(variant));
        var colors = VisualTheme.Graphite().Resolve(mode);
        return Chart.Create().WithXLabels("Mon", "Tue", "Wed", "Thu", "Fri", "Sat").WithDataLabels()
            .AddHexbinHeatmapRow("Primary", new double?[] { 0, 30, 40, null, 80, 100 }, id: new ChartSeriesId("primary-measurements"))
            .AddHexbinHeatmapRow("Secondary", new double?[] { 15, 40, 60, 80, null, 120 }, id: new ChartSeriesId("secondary-measurements"))
            .WithHeatmapColorScale(ChartColorScale.Discrete(new[] {
                new ChartColorBand(40, colors.SequentialRamp[0], "Low"),
                new ChartColorBand(80, colors.SequentialRamp[colors.SequentialRamp.Count / 2], "Medium"),
                new ChartColorBand(null, colors.SequentialRamp[colors.SequentialRamp.Count - 1], "High")
            })).WithValueFormat(ChartValueFormat.Number("0.##", CultureInfo.InvariantCulture));
    }
}