Preview
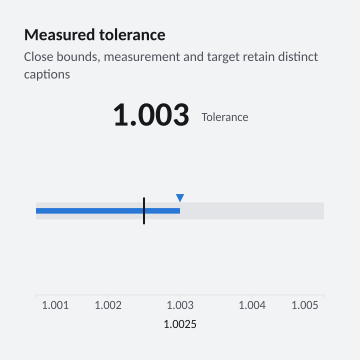
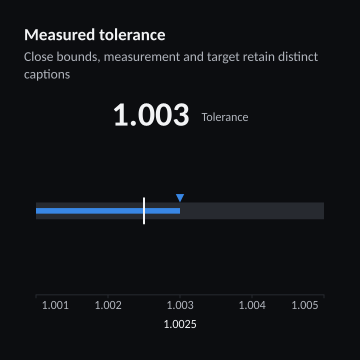
360 × 360 pixels
Create this example
Create a console project, add the ChartForgeX package, and replace Program.cs with this source. Run it to write SVG, PNG and HTML with the default system fonts.
For the same typography as the gallery, download the gallery-font recipe and copy the gallery’s fonts directory beside your program.
using System;
using System.Collections.Generic;
using System.Globalization;
using System.IO;
using System.Linq;
using ChartForgeX.Core;
using ChartForgeX.Primitives;
using ChartForgeX.Rendering;
using ChartForgeX.Themes;
using ChartForgeX.Topology;
using ChartForgeX.Typography;
using ChartForgeX.VisualArtifacts;
using ChartForgeX.VisualBlocks;

var mode = VisualThemeMode.Light;
var theme = VisualTheme.Graphite();
var model = GaugeRecipe.Create("compact-precision", mode);
var context = new VisualRenderContext(
    new VisualLayoutOptions(new VisualSize(360, 360)), theme, mode,
    new VisualFrame("Measured tolerance", "Close bounds, measurement and target retain distinct captions", showLegend: null, showSurface: false));
var prepared = model.Prepare(context);
File.WriteAllText("visual.svg", prepared.ToSvg());
File.WriteAllBytes("visual.png", prepared.ToPng());
File.WriteAllText("visual.html", prepared.ToArtifact("example", VisualArtifactKind.Chart).ToHtmlPage());

/// <summary>A measured value, target and qualitative bands on an arc, needle or precision scale.</summary>
public static class GaugeRecipe {
    /// <summary>Creates capacity against its target, or a close-bound linear tolerance measurement.</summary>
    public static Chart Create(string variant = "wide", VisualThemeMode mode = VisualThemeMode.Light) {
        if (variant is "precision" or "compact-precision") {
            var tolerance = ChartSeries.CreateGauge(new ChartSeriesId("tolerance"), "Tolerance",
                new ChartGaugeValue(1.003, 1.001, 1.005, new[] { new ChartGaugeTarget(1.0025) }));
            return Chart.Create().AddSeries(tolerance).ConfigureGauge(options => {
                options.Form = ChartGaugeForm.Linear;
            });
        }
        if (variant is not ("wide" or "compact" or "sparse" or "options" or "compact-options" or "vertical" or "compact-vertical" or "semicircle" or "compact-semicircle" or "full-circle" or "compact-full-circle"))
            throw new ArgumentOutOfRangeException(nameof(variant));
        var configured = variant is "vertical" or "compact-vertical" or "semicircle" or "compact-semicircle" or "full-circle" or "compact-full-circle";
        var capacity = ChartSeries.CreateGauge(new ChartSeriesId("capacity"), "Capacity",
            new ChartGaugeValue(76, targets: configured ? new[] { new ChartGaugeTarget(60, "Baseline"), new ChartGaugeTarget(85, "Goal") } : new[] { new ChartGaugeTarget(85) }));
        return Chart.Create().AddSeries(capacity)
            .WithValueFormat(ChartValueFormat.Number("0.##", System.Globalization.CultureInfo.InvariantCulture))
            .ConfigureGauge(options => {
                options.Form = variant is "options" or "compact-options" ? ChartGaugeForm.Needle : ChartGaugeForm.Arc;
                if (configured) options.TickCount = 5;
                if (variant is "vertical" or "compact-vertical") { options.Form = ChartGaugeForm.Linear; options.Orientation = ChartOrientation.Vertical; }
                if (variant is "semicircle" or "compact-semicircle") { options.StartAngleDegrees = 180; options.SweepAngleDegrees = 180; }
                if (variant is "full-circle" or "compact-full-circle") { options.StartAngleDegrees = -90; options.SweepAngleDegrees = 360; }
                options.Caption = "Available capacity";
                options.Bands.Add(new ChartGaugeBand(0, 50, ChartSeriesState.Danger));
                options.Bands.Add(new ChartGaugeBand(50, 80, ChartSeriesState.Warning));
                options.Bands.Add(new ChartGaugeBand(80, 100, ChartSeriesState.Success));
            });
    }
}
using System;
using System.Collections.Generic;
using System.Globalization;
using System.IO;
using System.Linq;
using ChartForgeX.Core;
using ChartForgeX.Primitives;
using ChartForgeX.Rendering;
using ChartForgeX.Themes;
using ChartForgeX.Topology;
using ChartForgeX.Typography;
using ChartForgeX.VisualArtifacts;
using ChartForgeX.VisualBlocks;

var mode = VisualThemeMode.Dark;
var theme = VisualTheme.Graphite();
var model = GaugeRecipe.Create("compact-precision", mode);
var context = new VisualRenderContext(
    new VisualLayoutOptions(new VisualSize(360, 360)), theme, mode,
    new VisualFrame("Measured tolerance", "Close bounds, measurement and target retain distinct captions", showLegend: null, showSurface: false));
var prepared = model.Prepare(context);
File.WriteAllText("visual.svg", prepared.ToSvg());
File.WriteAllBytes("visual.png", prepared.ToPng());
File.WriteAllText("visual.html", prepared.ToArtifact("example", VisualArtifactKind.Chart).ToHtmlPage());

/// <summary>A measured value, target and qualitative bands on an arc, needle or precision scale.</summary>
public static class GaugeRecipe {
    /// <summary>Creates capacity against its target, or a close-bound linear tolerance measurement.</summary>
    public static Chart Create(string variant = "wide", VisualThemeMode mode = VisualThemeMode.Light) {
        if (variant is "precision" or "compact-precision") {
            var tolerance = ChartSeries.CreateGauge(new ChartSeriesId("tolerance"), "Tolerance",
                new ChartGaugeValue(1.003, 1.001, 1.005, new[] { new ChartGaugeTarget(1.0025) }));
            return Chart.Create().AddSeries(tolerance).ConfigureGauge(options => {
                options.Form = ChartGaugeForm.Linear;
            });
        }
        if (variant is not ("wide" or "compact" or "sparse" or "options" or "compact-options" or "vertical" or "compact-vertical" or "semicircle" or "compact-semicircle" or "full-circle" or "compact-full-circle"))
            throw new ArgumentOutOfRangeException(nameof(variant));
        var configured = variant is "vertical" or "compact-vertical" or "semicircle" or "compact-semicircle" or "full-circle" or "compact-full-circle";
        var capacity = ChartSeries.CreateGauge(new ChartSeriesId("capacity"), "Capacity",
            new ChartGaugeValue(76, targets: configured ? new[] { new ChartGaugeTarget(60, "Baseline"), new ChartGaugeTarget(85, "Goal") } : new[] { new ChartGaugeTarget(85) }));
        return Chart.Create().AddSeries(capacity)
            .WithValueFormat(ChartValueFormat.Number("0.##", System.Globalization.CultureInfo.InvariantCulture))
            .ConfigureGauge(options => {
                options.Form = variant is "options" or "compact-options" ? ChartGaugeForm.Needle : ChartGaugeForm.Arc;
                if (configured) options.TickCount = 5;
                if (variant is "vertical" or "compact-vertical") { options.Form = ChartGaugeForm.Linear; options.Orientation = ChartOrientation.Vertical; }
                if (variant is "semicircle" or "compact-semicircle") { options.StartAngleDegrees = 180; options.SweepAngleDegrees = 180; }
                if (variant is "full-circle" or "compact-full-circle") { options.StartAngleDegrees = -90; options.SweepAngleDegrees = 360; }
                options.Caption = "Available capacity";
                options.Bands.Add(new ChartGaugeBand(0, 50, ChartSeriesState.Danger));
                options.Bands.Add(new ChartGaugeBand(50, 80, ChartSeriesState.Warning));
                options.Bands.Add(new ChartGaugeBand(80, 100, ChartSeriesState.Success));
            });
    }
}