ChartForgeX separates visual forms so exact facts, trends, relationships, and composed assets do not have to pretend to be the same chart.
| Output | Need | Start with |
|---|---|---|
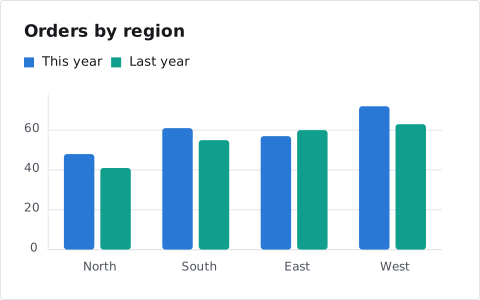 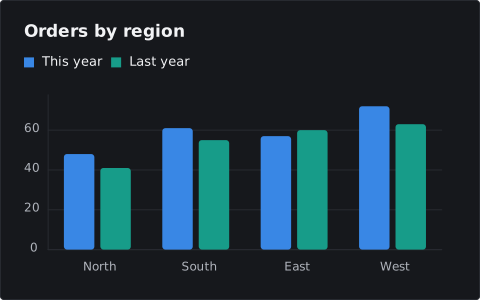 | Trends, comparisons, distributions, and statistical views | Chart |
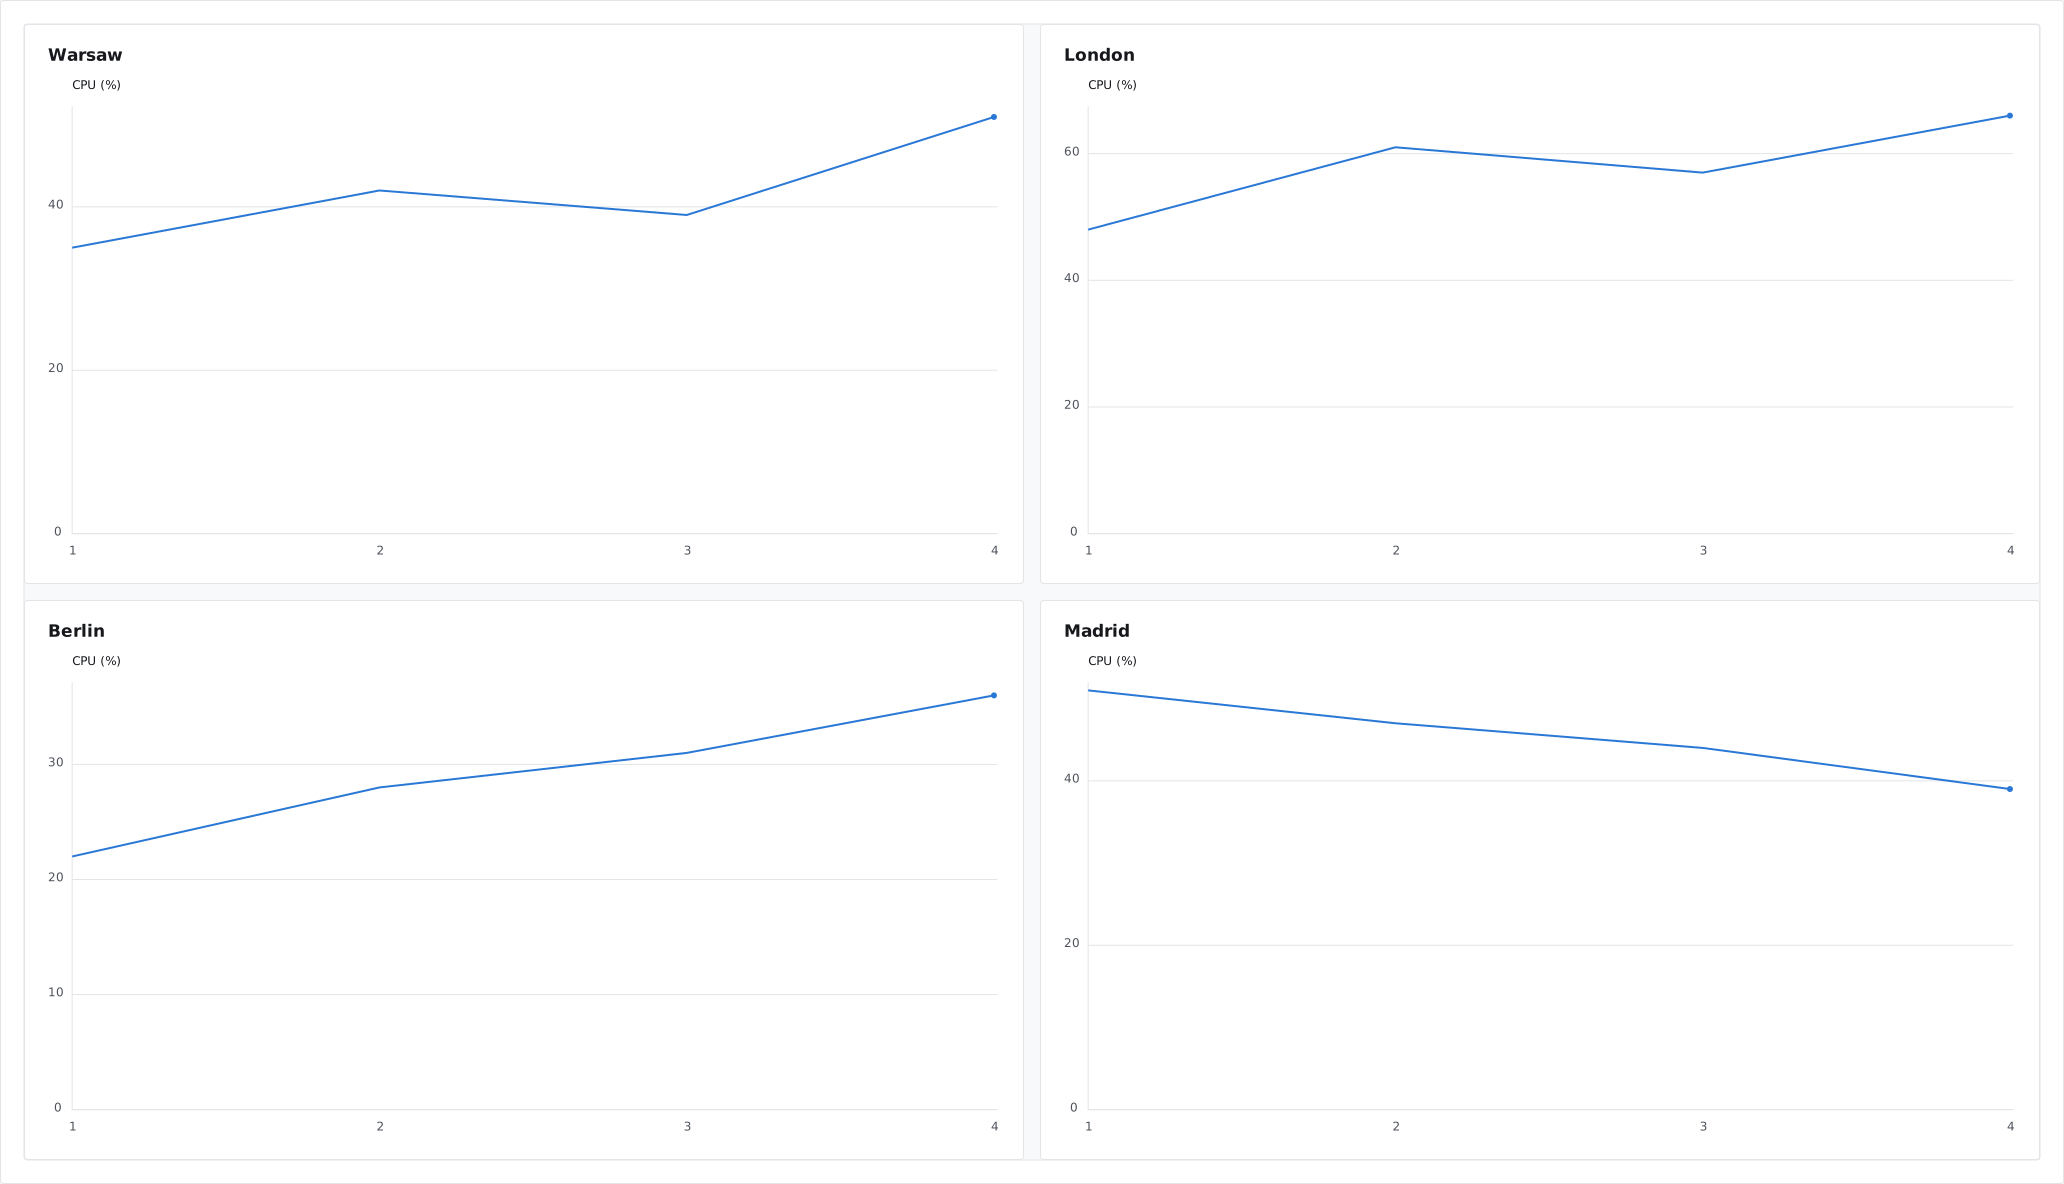 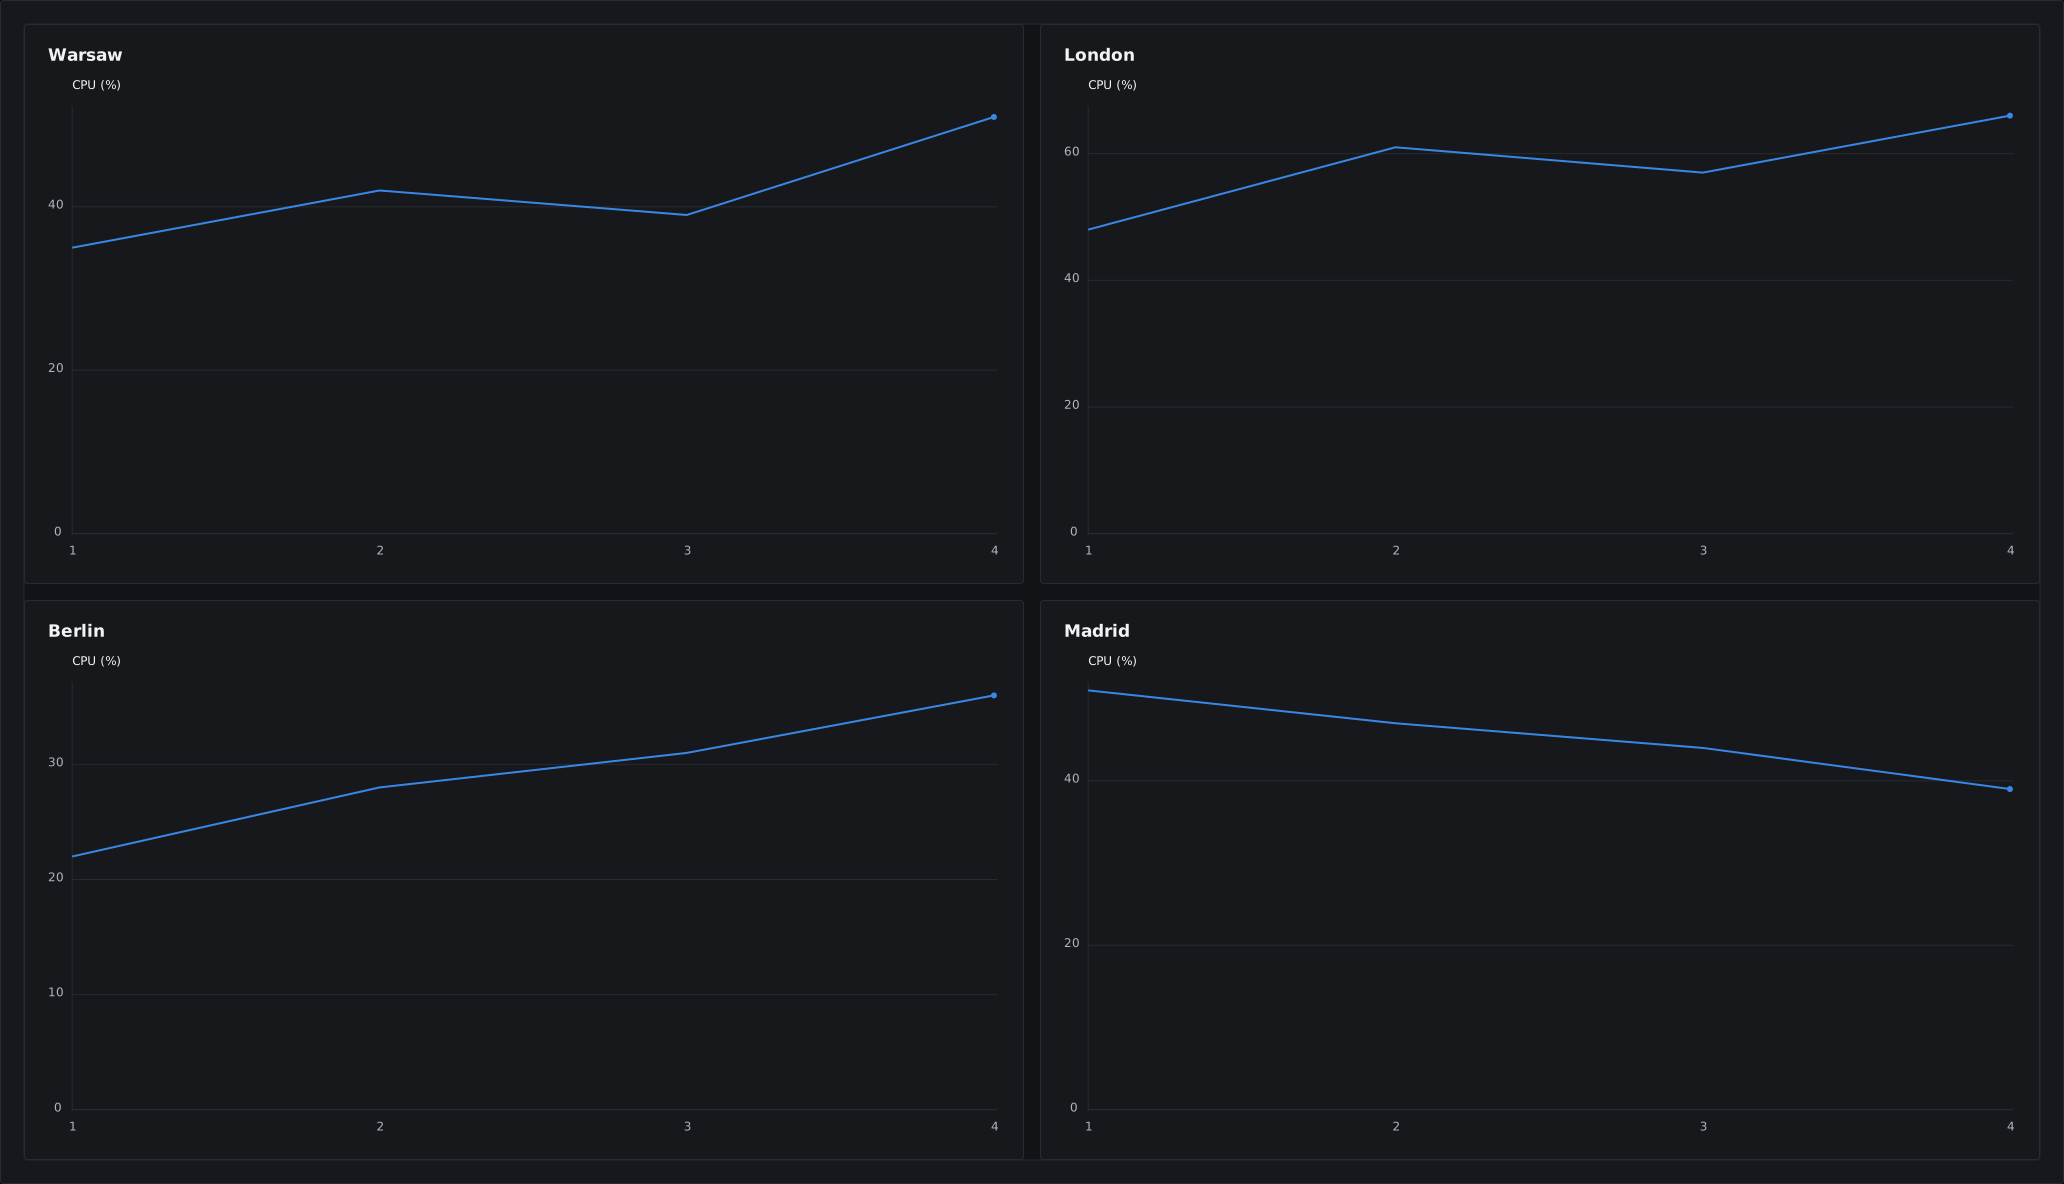 | Repeated chart panels and small multiples | ChartGrid |
  | Exact facts, KPI cards, tables, lists, and timelines | ChartForgeX.VisualBlocks |
  | Fixed-size layered artwork such as wallpapers or social cards | VisualCanvas or ImageComposition |
  | Services, ownership, routes, maps, and compact hierarchies | TopologyChart |
  | Large editable or navigable relationship scenes | GraphScene plus ChartForgeX.Interactivity.Html |
  | Markdown or Mermaid-authored visuals | ChartForgeX.Markup and ChartForgeX.Mermaid |
Static output is the default. Add interaction only when the reader benefits from search, selection, zoom, hierarchy navigation, scenarios, or export controls.