Skip to content
ChartForgeX

ChartForgeX documentation

Choose a ChartForgeX rendering surface and move from data to deterministic visual output.

dotnet add package ChartForgeX
overview.svgChartGrid, 39.3 KB
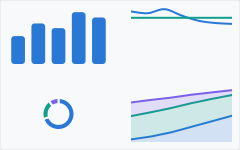
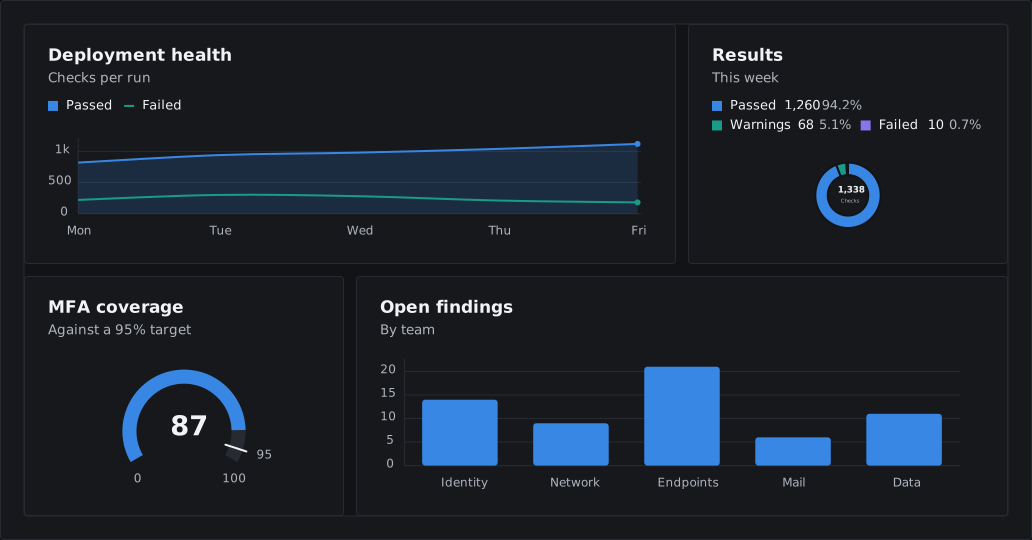
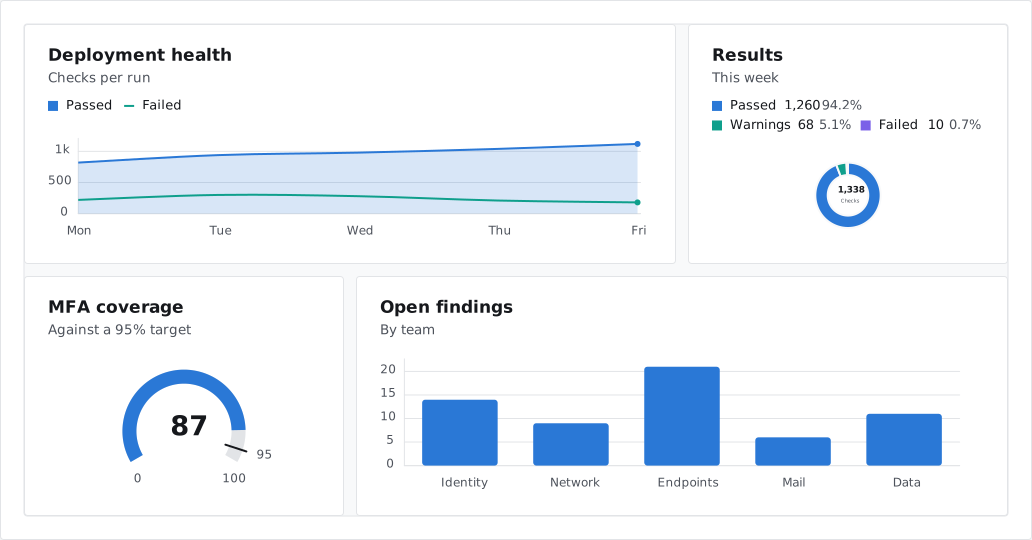
A report grid rendered by ChartForgeX: deployment health as an area chart, results as a donut, MFA coverage as a gauge and open findings by team as bars.

Topics

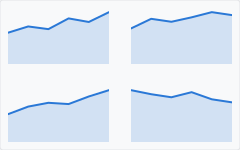
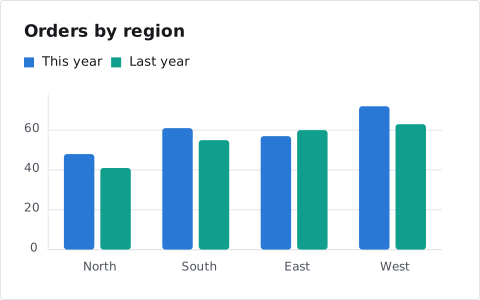
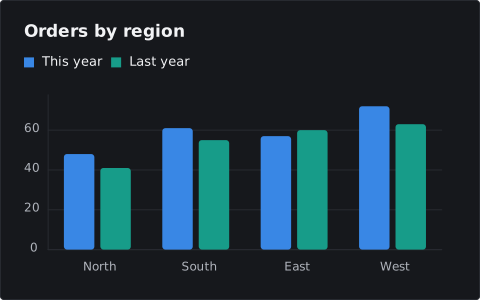
Each topic below is shown with the kind of output it covers, rendered by ChartForgeX for this page.

  1. 01 Overview Where ChartForgeX fits and what its deterministic rendering model provides.
  2. 02 Install The core package, and the optional adapters a host adds when it needs them.
  3. 03 Choose a surface Charts, grids, visual blocks, canvases, topology and explorers, matched to the job.
  4. 04 Topology and hierarchy Service maps, ownership trees, routes and dense hierarchies from your own records.
  5. 05 Interactive HTML Self-contained pages with search, selection, zoom and drill-down, without changing static output.
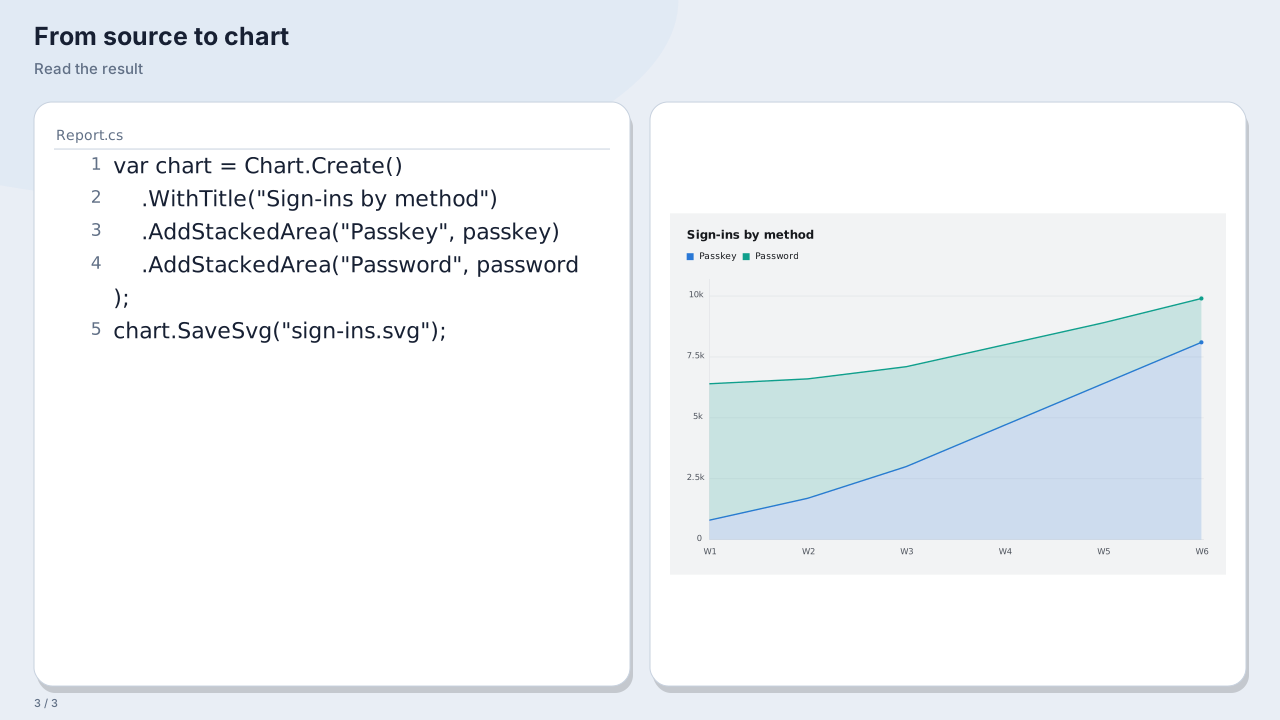
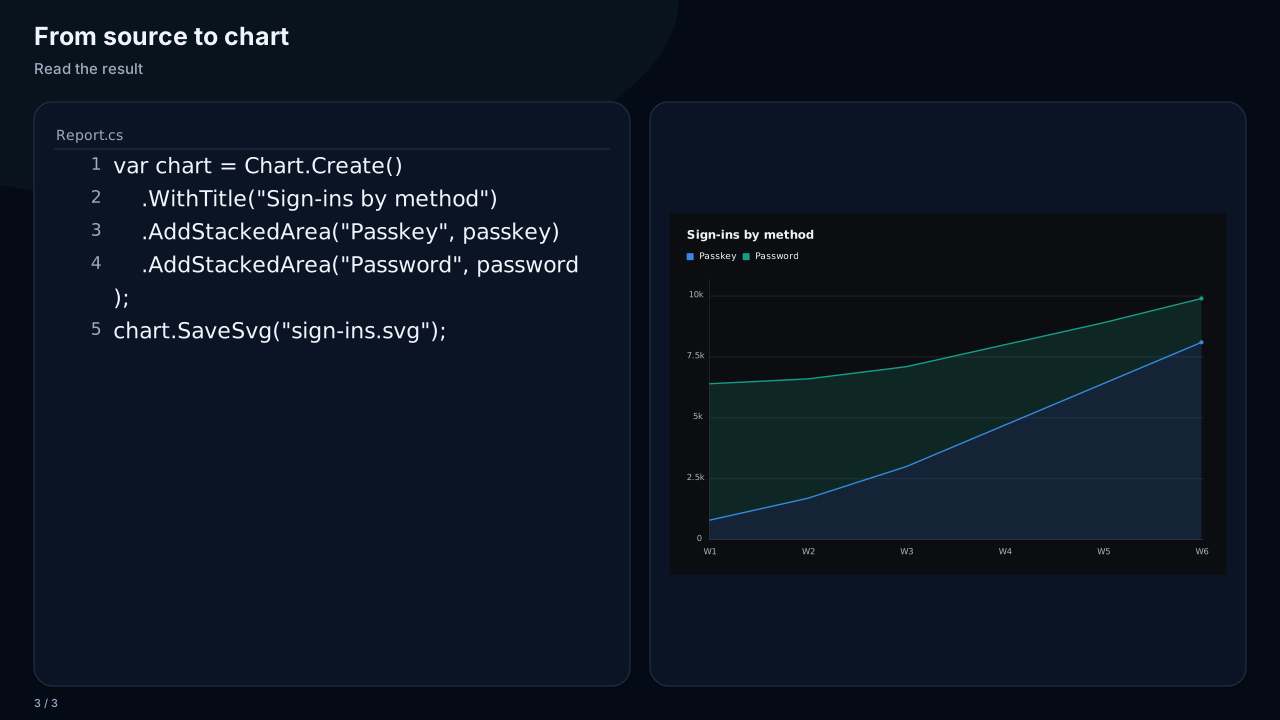
  6. 06 Stories and replays Source edits, terminal sessions and results on one playback clock, exported as SVG, GIF or APNG.